Fig. 4
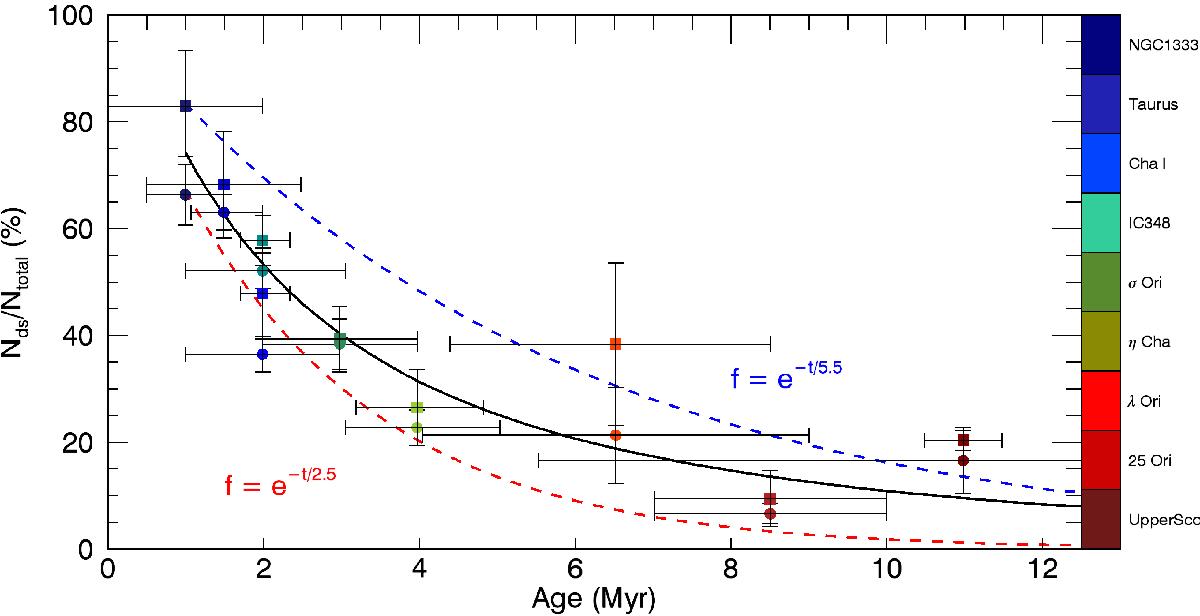
Disk fraction as a function of time (solid black line) obtained from our simulations considering η = 1.5 and tth = 2.2 Myr. The colored dashed lines are the exponential decay laws expected from disk e-folding times 2.5 Myr (red line) and 5.5 Myr (blue line). The colored dots are data for nine young nearby associations from Ribas et al. (2014, circles), Hernández et al. (2007), and Hernández et al. (2008, squares).
Current usage metrics show cumulative count of Article Views (full-text article views including HTML views, PDF and ePub downloads, according to the available data) and Abstracts Views on Vision4Press platform.
Data correspond to usage on the plateform after 2015. The current usage metrics is available 48-96 hours after online publication and is updated daily on week days.
Initial download of the metrics may take a while.