Fig. 11
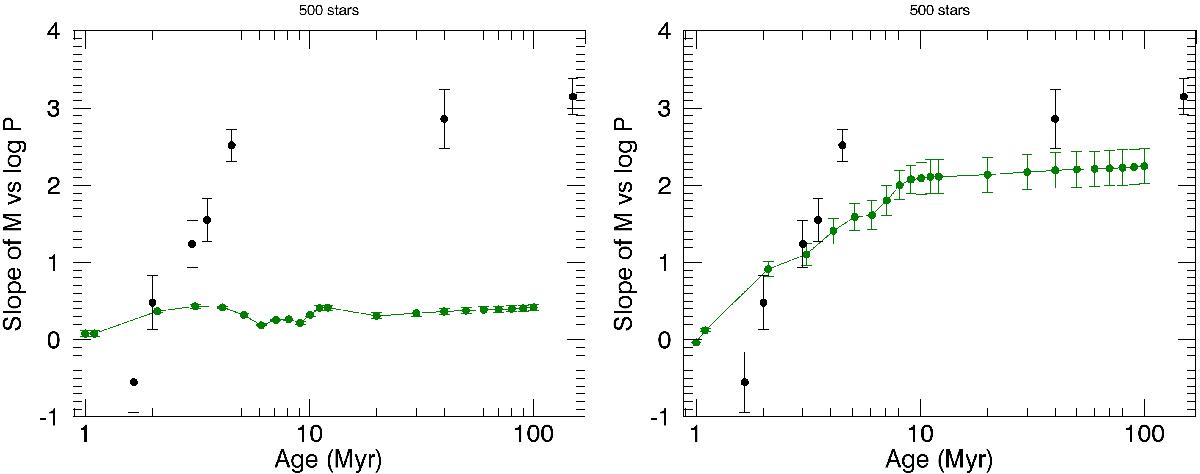
Left: slope of the log P− mass relationship as a function of age recovered from the simulations (green dots) and superimposed to data points from Henderson & Stassun (2012) for seven nearby clusters. The error bars of the green dots are equal to the standard errors of the estimate of the least-squares fits. Right: same plot for a modified model without disk locking for the 0.3 M⊙ stars.
Current usage metrics show cumulative count of Article Views (full-text article views including HTML views, PDF and ePub downloads, according to the available data) and Abstracts Views on Vision4Press platform.
Data correspond to usage on the plateform after 2015. The current usage metrics is available 48-96 hours after online publication and is updated daily on week days.
Initial download of the metrics may take a while.