Fig. 9
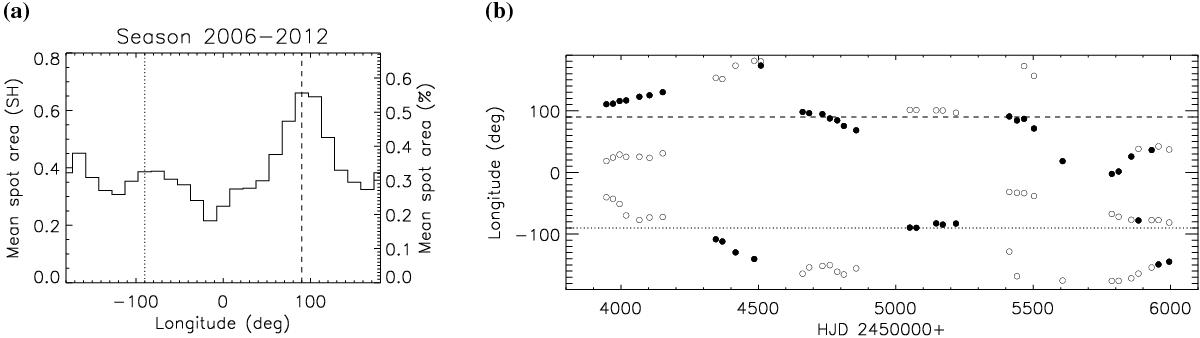
Active longitudes on XX Tri from 2006 to 2012. a) The overall mean distribution of the spot area (histogram in bins of 15°) is shown. The spot area is given in solar hemispheres on the left axis (1 SH = 3.05 Gm2) and relative to the total area of a stellar hemisphere of XX Tri on the right axis. The dashed line represents the phase toward the companion star, whereas the dotted line represents the phase in the opposite direction. b) Spot longitudes as a function of time. Spots A–E from all Doppler images are shown. The filled dots represent the larger spot at any given time. The dashed and dotted lines represent again the phases toward the companion star and in the opposite direction, respectively.
Current usage metrics show cumulative count of Article Views (full-text article views including HTML views, PDF and ePub downloads, according to the available data) and Abstracts Views on Vision4Press platform.
Data correspond to usage on the plateform after 2015. The current usage metrics is available 48-96 hours after online publication and is updated daily on week days.
Initial download of the metrics may take a while.