Fig. 4
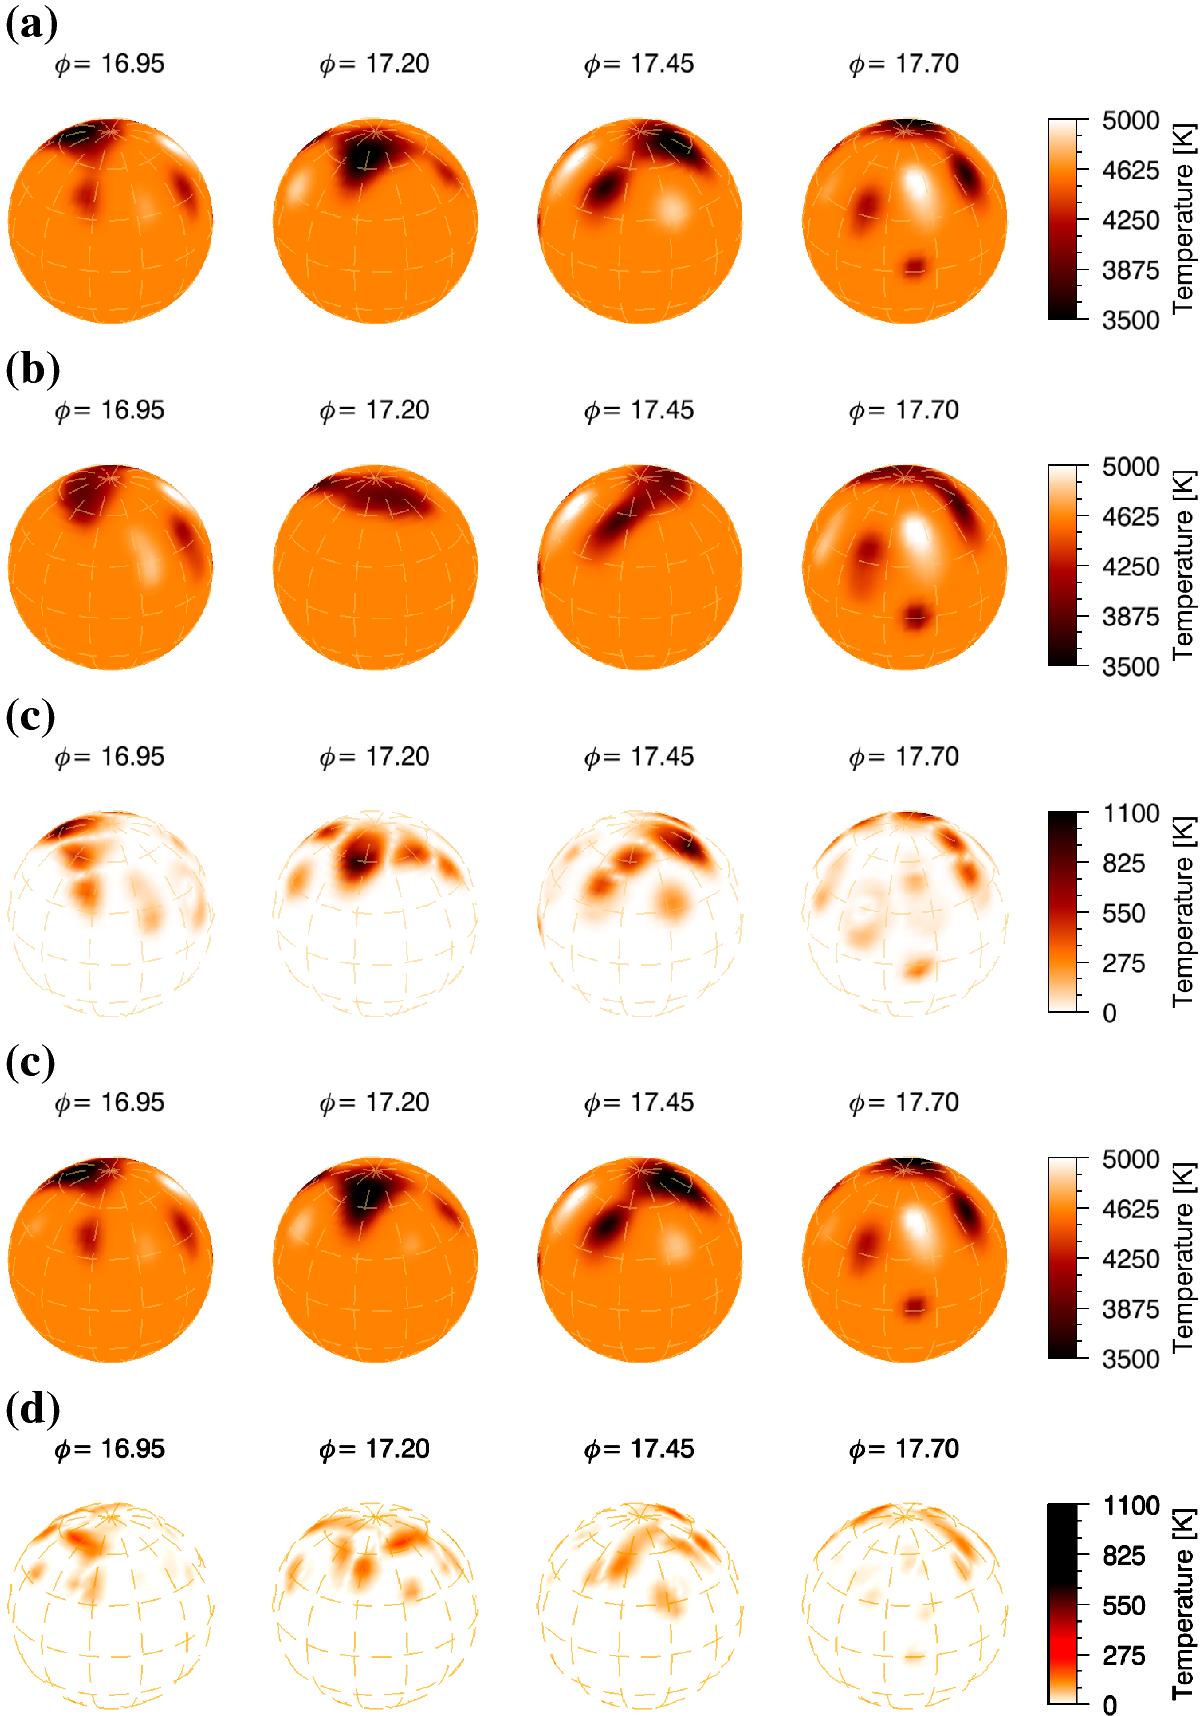
Test #1 of the influence of phase gaps and filled gaps. Each image is shown in four spherical projections 90° apart. a) Input map. This map is identical to the first reconstruction from season 2007/08 (DI #8 from 2007.67) with a total of 21 phases. b) The reconstruction when ignoring phases No. 4–9 in the inversion process. c) The (absolute) difference a − b. d) The reconstruction when the phase gap is filled with phases from the following stellar rotation. e) The (absolute) difference a − d.
Current usage metrics show cumulative count of Article Views (full-text article views including HTML views, PDF and ePub downloads, according to the available data) and Abstracts Views on Vision4Press platform.
Data correspond to usage on the plateform after 2015. The current usage metrics is available 48-96 hours after online publication and is updated daily on week days.
Initial download of the metrics may take a while.