Fig. E.1
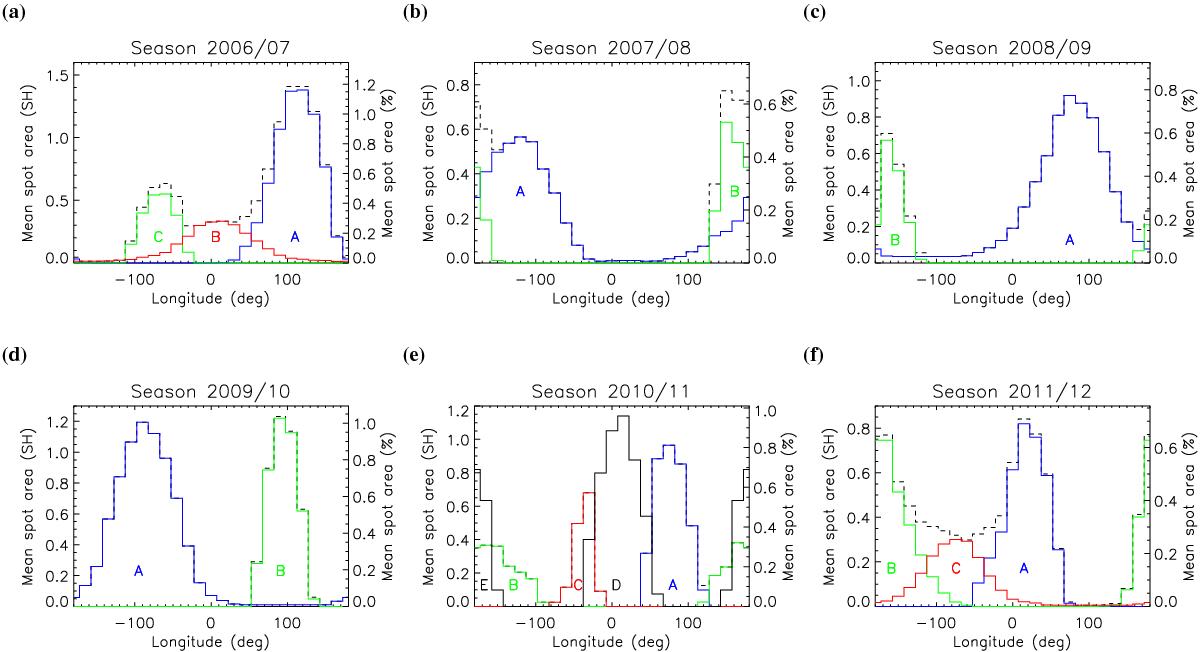
Longitudinal spot area distribution on XX Tri from 2006 to 2012. Shown are the seasonal mean distributions of the individual spots (solid colored lines) from our spot-model fits for each observing season. The black dashed line represents the total spotted area. The spot area is given in solar hemispheres on the left axis (1 SH=3.05 Gm2) and relative to the total area of a stellar hemisphere of XX Tri on the right axis.
Current usage metrics show cumulative count of Article Views (full-text article views including HTML views, PDF and ePub downloads, according to the available data) and Abstracts Views on Vision4Press platform.
Data correspond to usage on the plateform after 2015. The current usage metrics is available 48-96 hours after online publication and is updated daily on week days.
Initial download of the metrics may take a while.