Fig. C.1
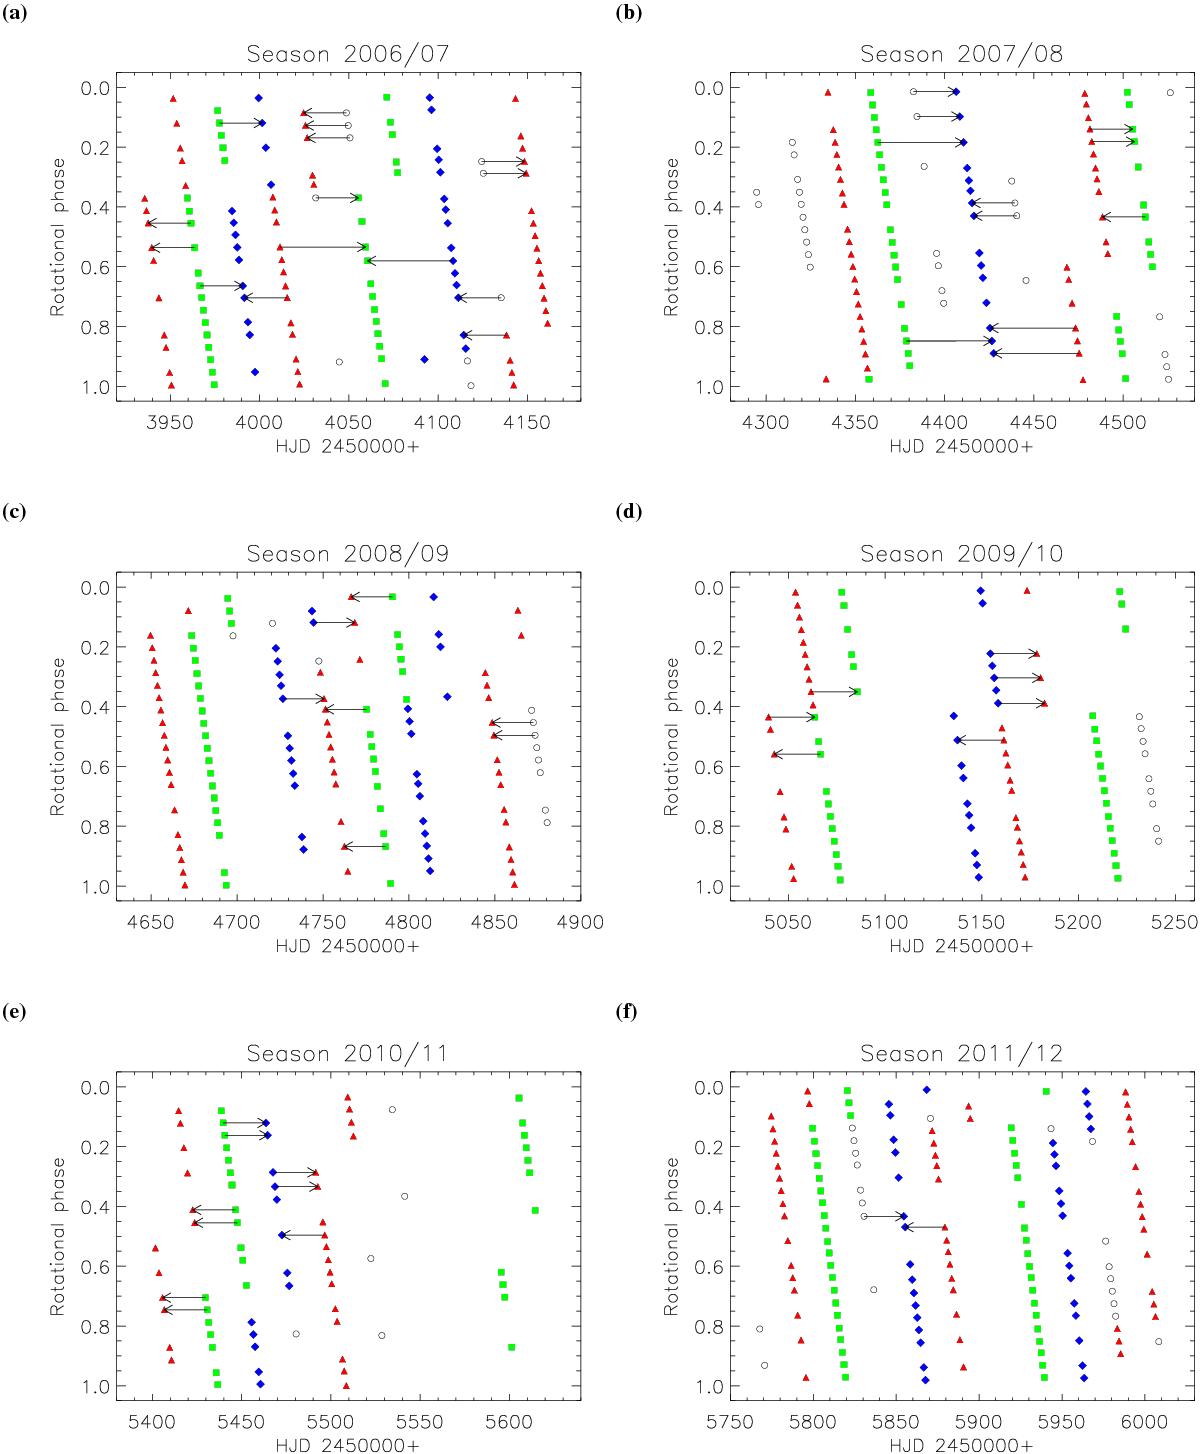
Phase coverage of Doppler images from 2006 to 2012. Different filled (colored) symbols represents the phases of each individual Doppler image, whereas not-filled circles represents non-used spectra (except for gap filling). The arrows indicate the spectra, which were used to fill up large observational gaps. Detailed information is given in Table 3.
Current usage metrics show cumulative count of Article Views (full-text article views including HTML views, PDF and ePub downloads, according to the available data) and Abstracts Views on Vision4Press platform.
Data correspond to usage on the plateform after 2015. The current usage metrics is available 48-96 hours after online publication and is updated daily on week days.
Initial download of the metrics may take a while.