Fig. 1
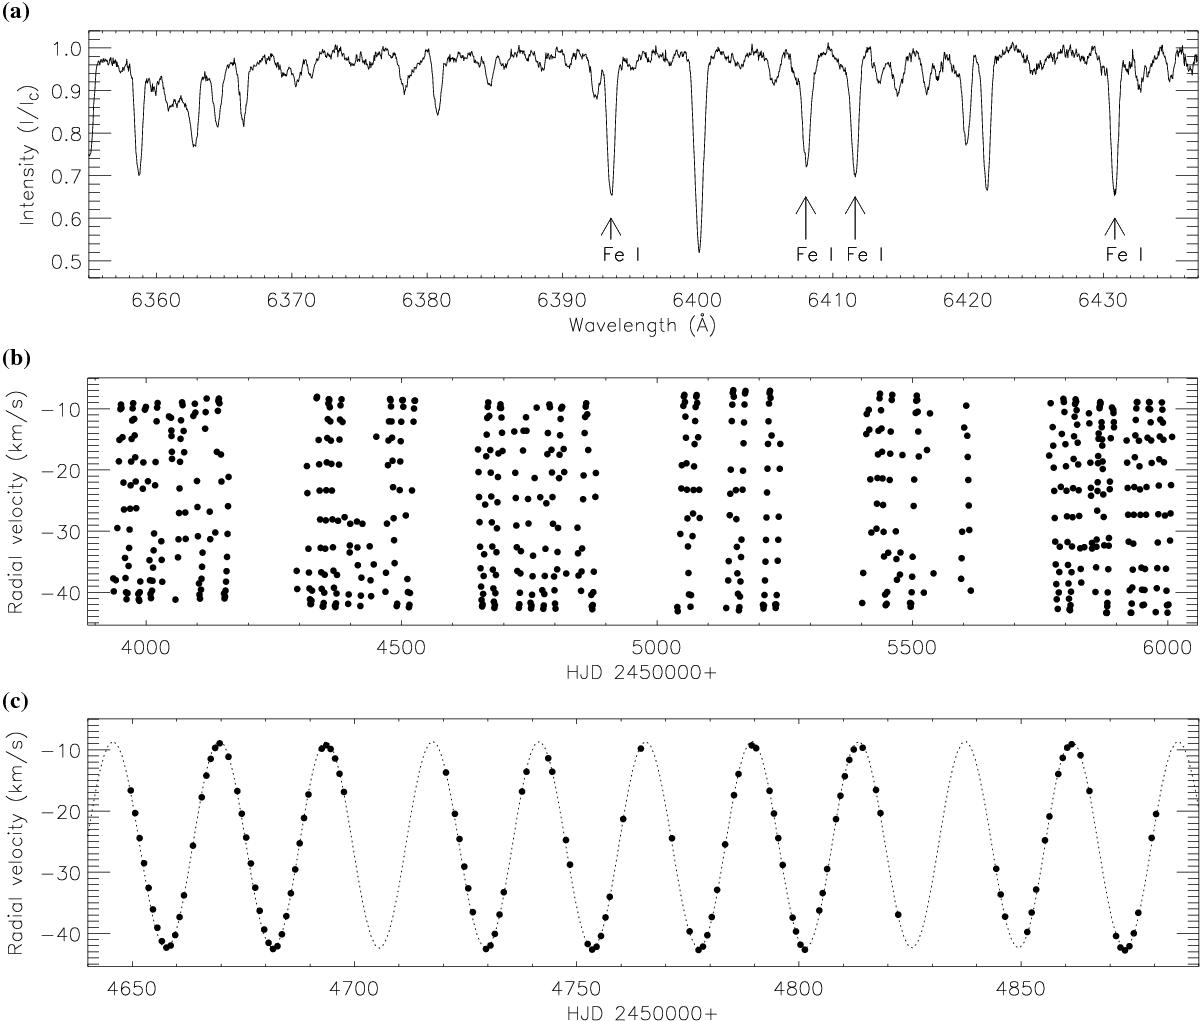
STELLA spectroscopy of XX Tri. a) A section of a representative single spectrum showing a subset of the spectral lines used for the Doppler imaging inversions. b) The full time-series radial velocities from a cross-correlation analysis. It shows the rotational phase sampling for the STELLA spectra. Each dot is from a full echelle spectrum, covering the wavelength range 390–880 nm. c) A section of b) referring to the observational season 2008/09. The dotted line represents a radial-velocity fit.
Current usage metrics show cumulative count of Article Views (full-text article views including HTML views, PDF and ePub downloads, according to the available data) and Abstracts Views on Vision4Press platform.
Data correspond to usage on the plateform after 2015. The current usage metrics is available 48-96 hours after online publication and is updated daily on week days.
Initial download of the metrics may take a while.