Fig. 9
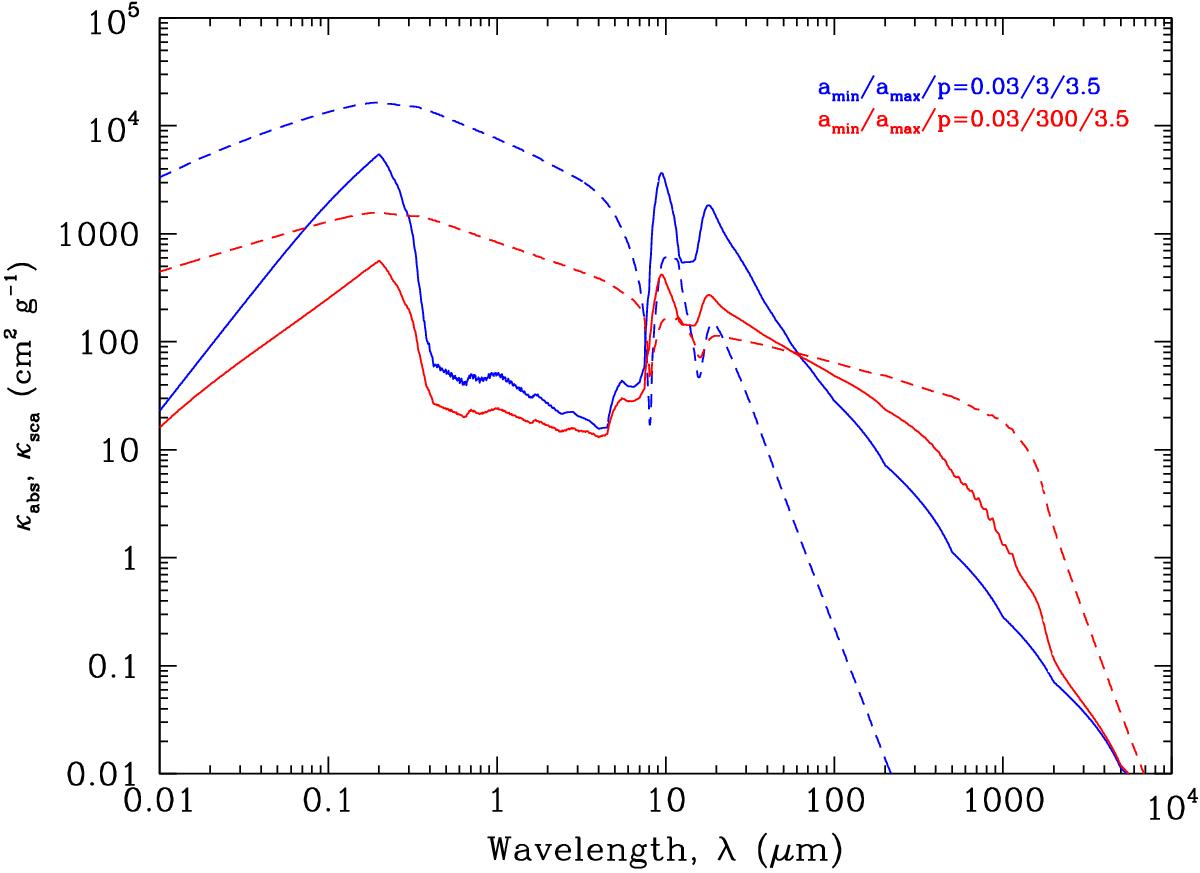
Extinction curves used for Model I, where the mass extinction coefficient is given by κext(λ) = κabs(λ) + κsca(λ). Solid lines are for mass absorption coefficients κabs and dashes are for the scattering, κsca. The curves are based on the optical constants provided by Jaeger et al. (1994) and by Dorschner et al. (1995) for two grain populations. The adopted grain size distributions have an exponent p = 3.5, and minimal sizes are amin = 0.03μm for both. The largest sizes are amax = 3μm (blue) and amax = 300μm (red).
Current usage metrics show cumulative count of Article Views (full-text article views including HTML views, PDF and ePub downloads, according to the available data) and Abstracts Views on Vision4Press platform.
Data correspond to usage on the plateform after 2015. The current usage metrics is available 48-96 hours after online publication and is updated daily on week days.
Initial download of the metrics may take a while.