Fig. 7
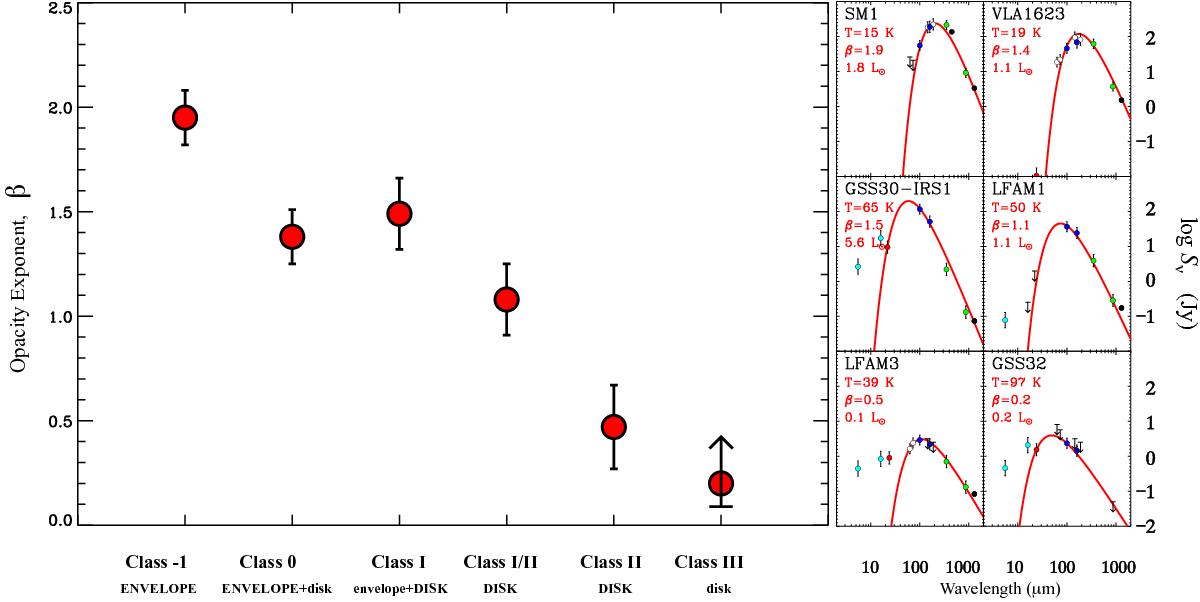
Left: time evolution of the opacity exponent β, where κν ∝ νβ, and the values are derived from the fits to the adjacent SEDs. Right: SEDs of the point sources SM 1, VLA 1623, GSS 30-IRS1, LFAM 1, LFAM 3 AND GSS 32, belonging to different evolutionary classes (see Fig. 2). The β-values decrease from 2 for the starless dense dust core SM 1 to 0.2 for the visible T Tauri star GSS 32. Colour coding of the symbols is light blue: ISO-CVF 5.5 μm and 16 μm. Red: WISE 22 μm or Spitzer 24 μm. Blue: Herschel-PACS 100 μm and 160 μm. White: PACS-spectra at 63, 73, 145 and 189 μm. Green: APEX 350 and 870 μm. Black refers to literature data: Wilson et al. (1999, 450 μ and Motte et al. (1998, 1.3 mm).
Current usage metrics show cumulative count of Article Views (full-text article views including HTML views, PDF and ePub downloads, according to the available data) and Abstracts Views on Vision4Press platform.
Data correspond to usage on the plateform after 2015. The current usage metrics is available 48-96 hours after online publication and is updated daily on week days.
Initial download of the metrics may take a while.