Free Access
Fig. 6
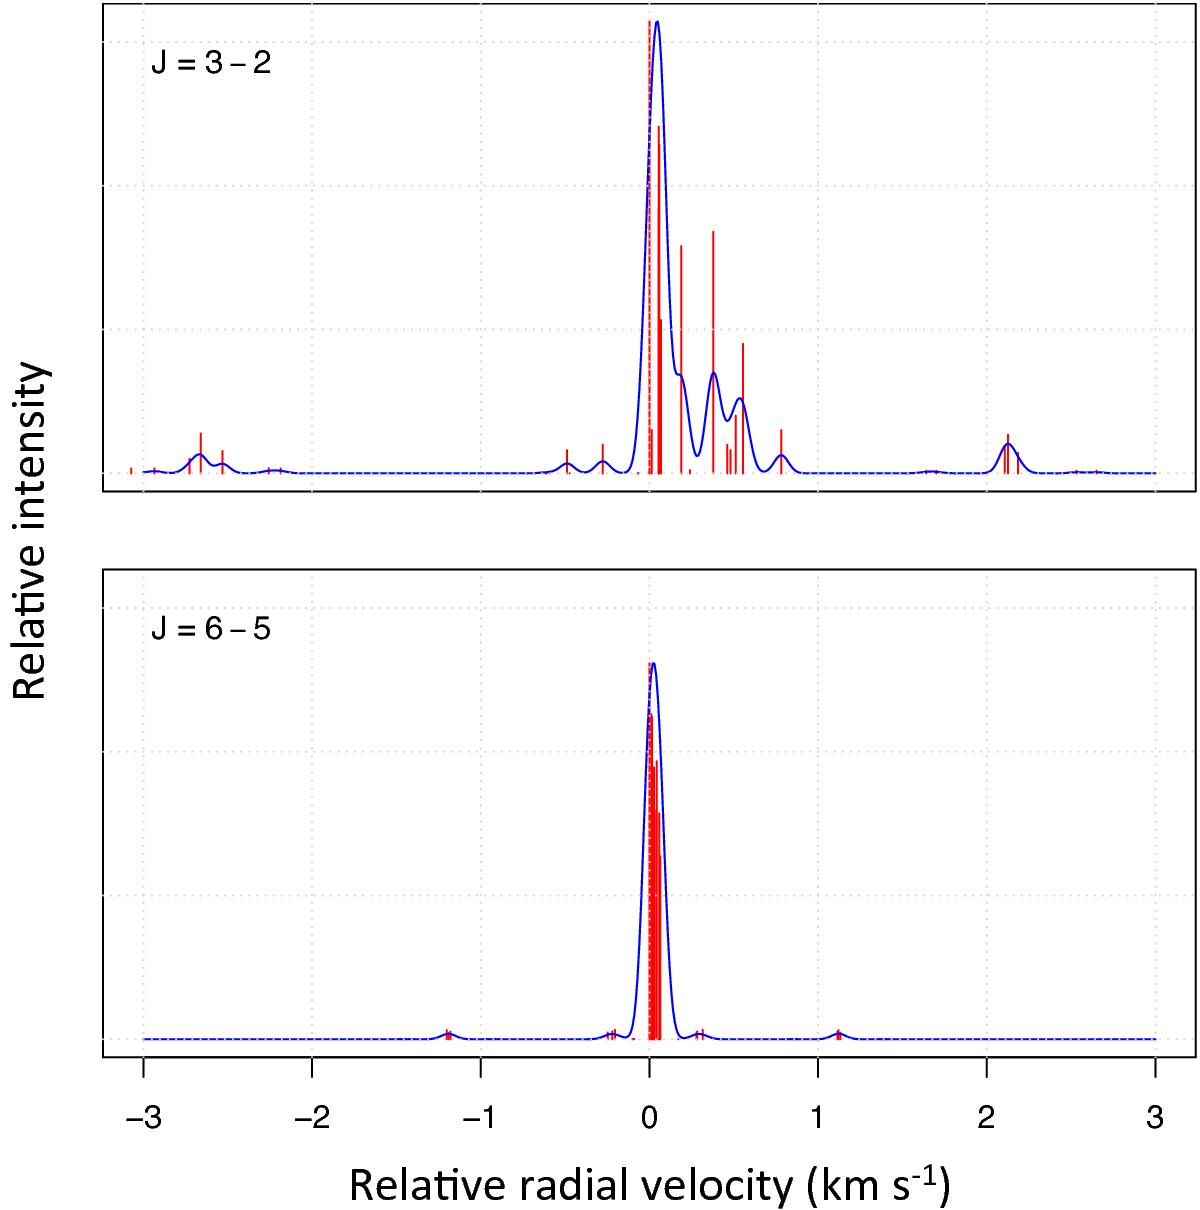
Hyperfine line strengths (red vertical bars) for the J = 3−2 (upper panel) and J = 6−5 (lower panel) transitions. The blue curves are theoretical profiles for an optical depth of 0.1 and a line width of 0.1 km s-1, scaled to the same maximum amplitude as the LTE line strengths.
Current usage metrics show cumulative count of Article Views (full-text article views including HTML views, PDF and ePub downloads, according to the available data) and Abstracts Views on Vision4Press platform.
Data correspond to usage on the plateform after 2015. The current usage metrics is available 48-96 hours after online publication and is updated daily on week days.
Initial download of the metrics may take a while.