Fig. 5
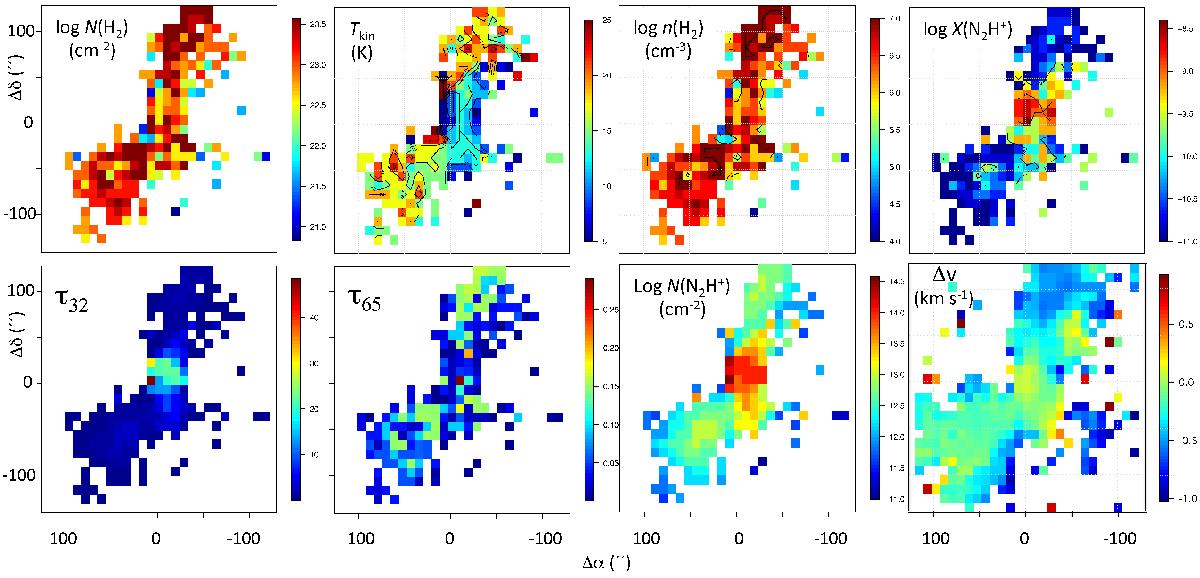
Best-fit parameters from the ALI modelling of the observed N2H+ maps, yielding results as shown in Fig. 4. Modelled data use an intensity threshold of 3σ of the rms noise for both lines. Upper row: from left to right, spatial distributions for the gas column density, N(H2), the kinetic gas temperature, Tkin, the gas volume density, n(H2) and the relative molecular abundance, X(N2H+) = n(N2H+)/n(H2). Lower row: from left to right, spatial distributions for the line centre optical depth of the (3−2) and (6−5) lines, the N2H+ column density, N(N2H+), and the residuals of the radial velocity fits Δv in km s-1. Spatial scales are in arcsec and the colour coding is given by the vertical bars next to each frame.
Current usage metrics show cumulative count of Article Views (full-text article views including HTML views, PDF and ePub downloads, according to the available data) and Abstracts Views on Vision4Press platform.
Data correspond to usage on the plateform after 2015. The current usage metrics is available 48-96 hours after online publication and is updated daily on week days.
Initial download of the metrics may take a while.