Fig. 4
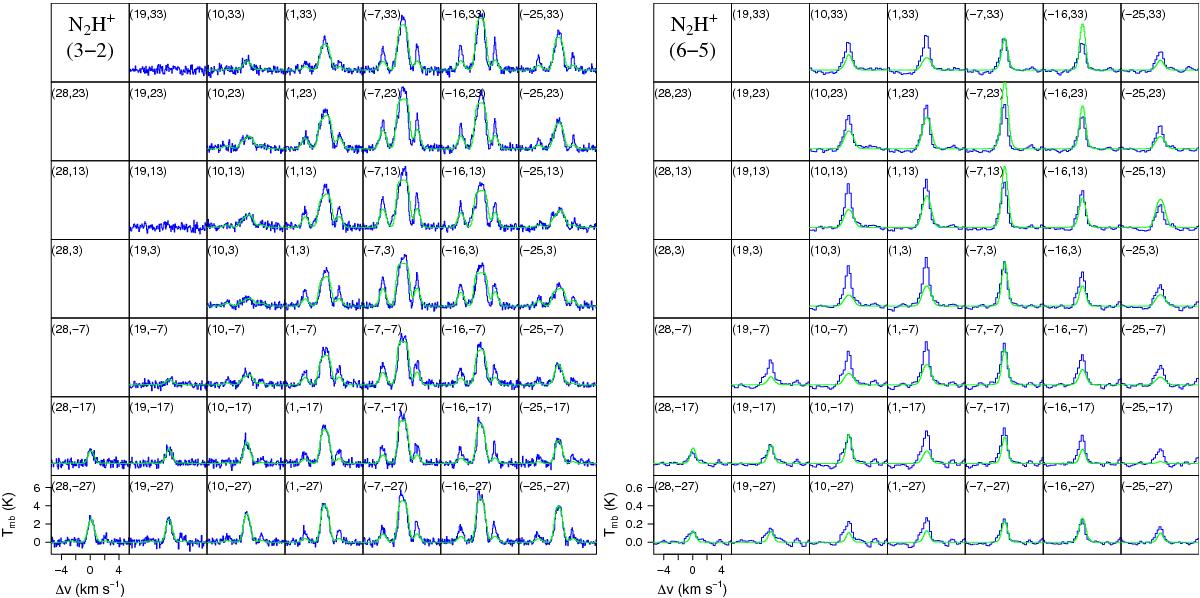
Centre of the three sub-regions of the mapped area showing the best-fit models (green) for the observed (blue) N2H+ (3–2) and (6–5) line profiles (left and right, respectively). The radiative transfer with ALI takes the overlapping transitions of the 38 hyperfine components into account, with the frequencies of Pagani et al. (2009). In the small frames, the numbers in the upper left corners are equatorial offsets in arcsec from the map origin (0, 0). In the lower left frames, the scales are given for Tmb (K) and Δv = υ−υLSR (υLSR = +3.5 km s-1), respectively (Figs. 5 and 6).
Current usage metrics show cumulative count of Article Views (full-text article views including HTML views, PDF and ePub downloads, according to the available data) and Abstracts Views on Vision4Press platform.
Data correspond to usage on the plateform after 2015. The current usage metrics is available 48-96 hours after online publication and is updated daily on week days.
Initial download of the metrics may take a while.