Fig. 3
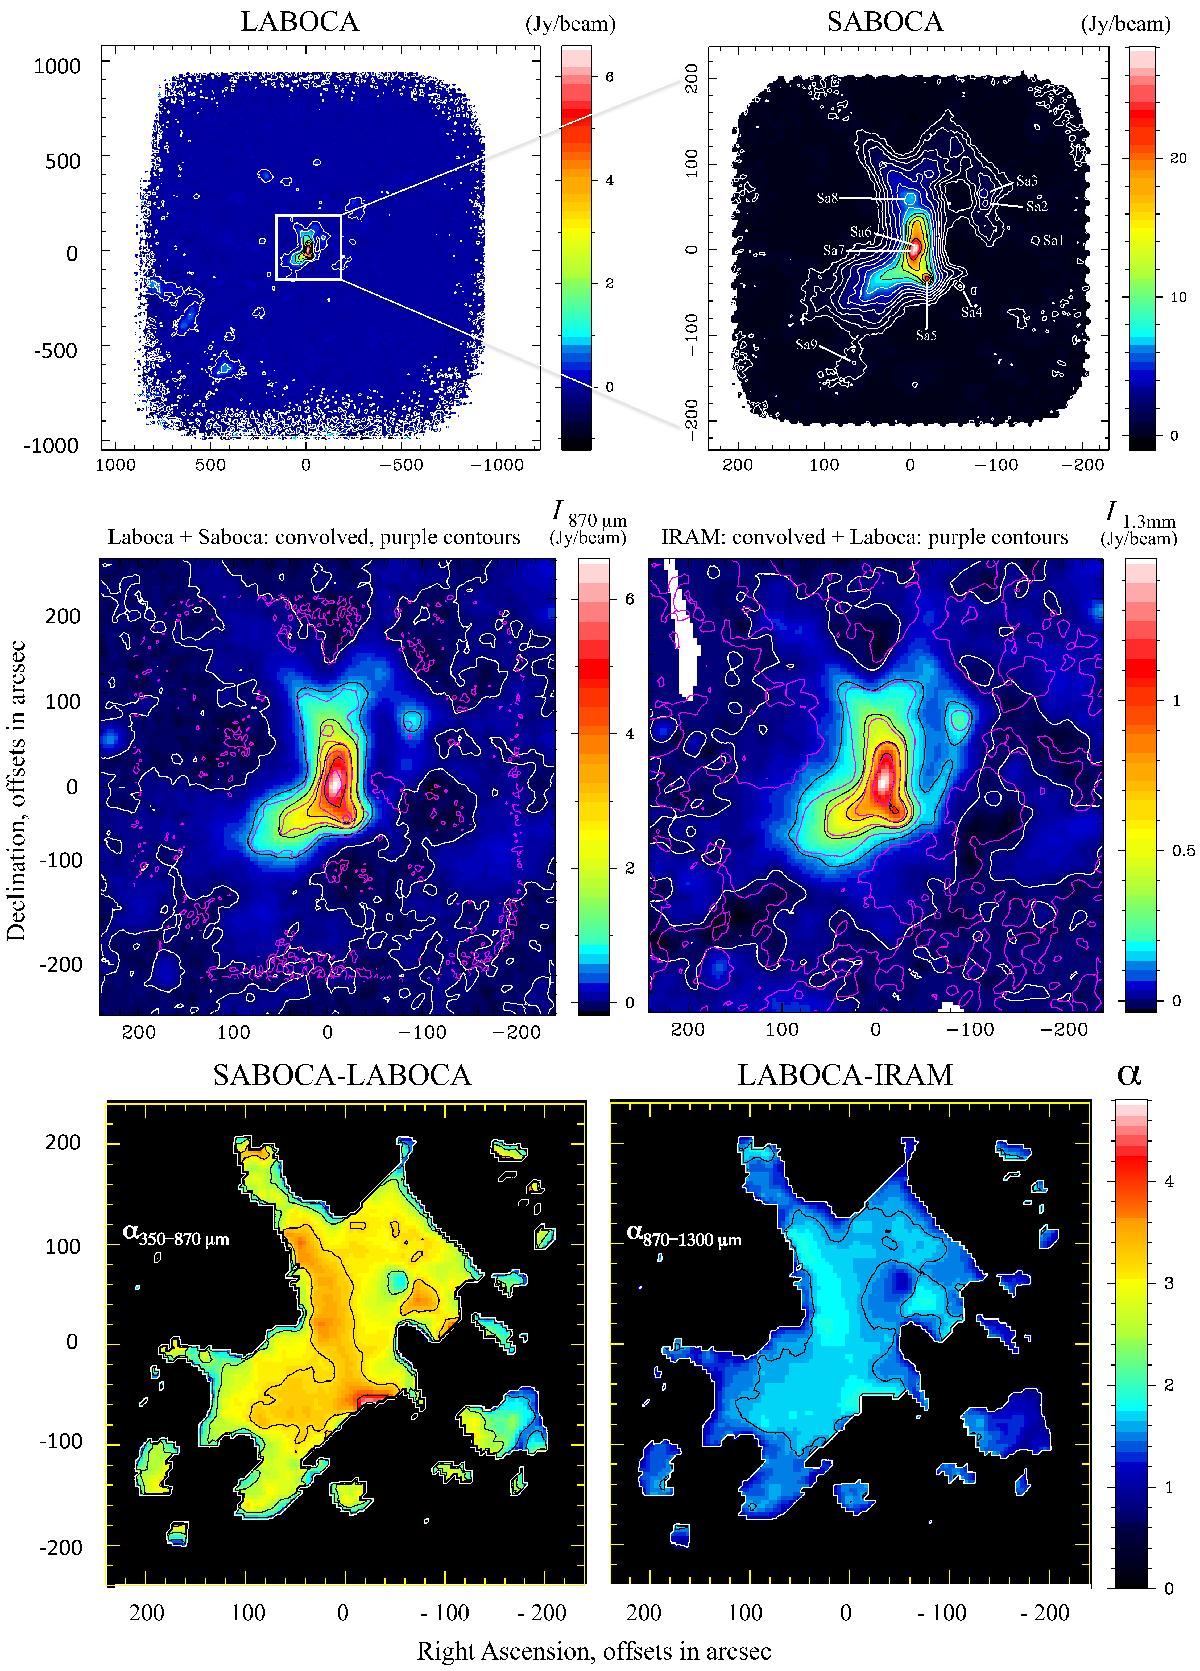
Top: ρ Oph A observed at 870 μm with LABOCA (left) and at 350 μm with SABOCA (right). Offsets are in seconds of arc and units are in Jy/beam. The origin, (0, 0), is the same as in Fig. 1 and the numbers refer to Table 2. Middle: SABOCA data (left, purple contours), degraded to the 19![]() 5 resolution of the LABOCA map (in colour). The colours show the IRAM map (right) of Motte et al. (1998), convolved to 19
5 resolution of the LABOCA map (in colour). The colours show the IRAM map (right) of Motte et al. (1998), convolved to 19![]() 5 resolution, and shifted to the position of the LABOCA origin. The LABOCA data are shown as purple contours. Bottom: observed spectral index α = Δlog Iν/ Δlog ν for the wavebands 350 μm–870 μm (left) and 870 μm–1.3 mm (right).
5 resolution, and shifted to the position of the LABOCA origin. The LABOCA data are shown as purple contours. Bottom: observed spectral index α = Δlog Iν/ Δlog ν for the wavebands 350 μm–870 μm (left) and 870 μm–1.3 mm (right).
Current usage metrics show cumulative count of Article Views (full-text article views including HTML views, PDF and ePub downloads, according to the available data) and Abstracts Views on Vision4Press platform.
Data correspond to usage on the plateform after 2015. The current usage metrics is available 48-96 hours after online publication and is updated daily on week days.
Initial download of the metrics may take a while.