Fig. 2
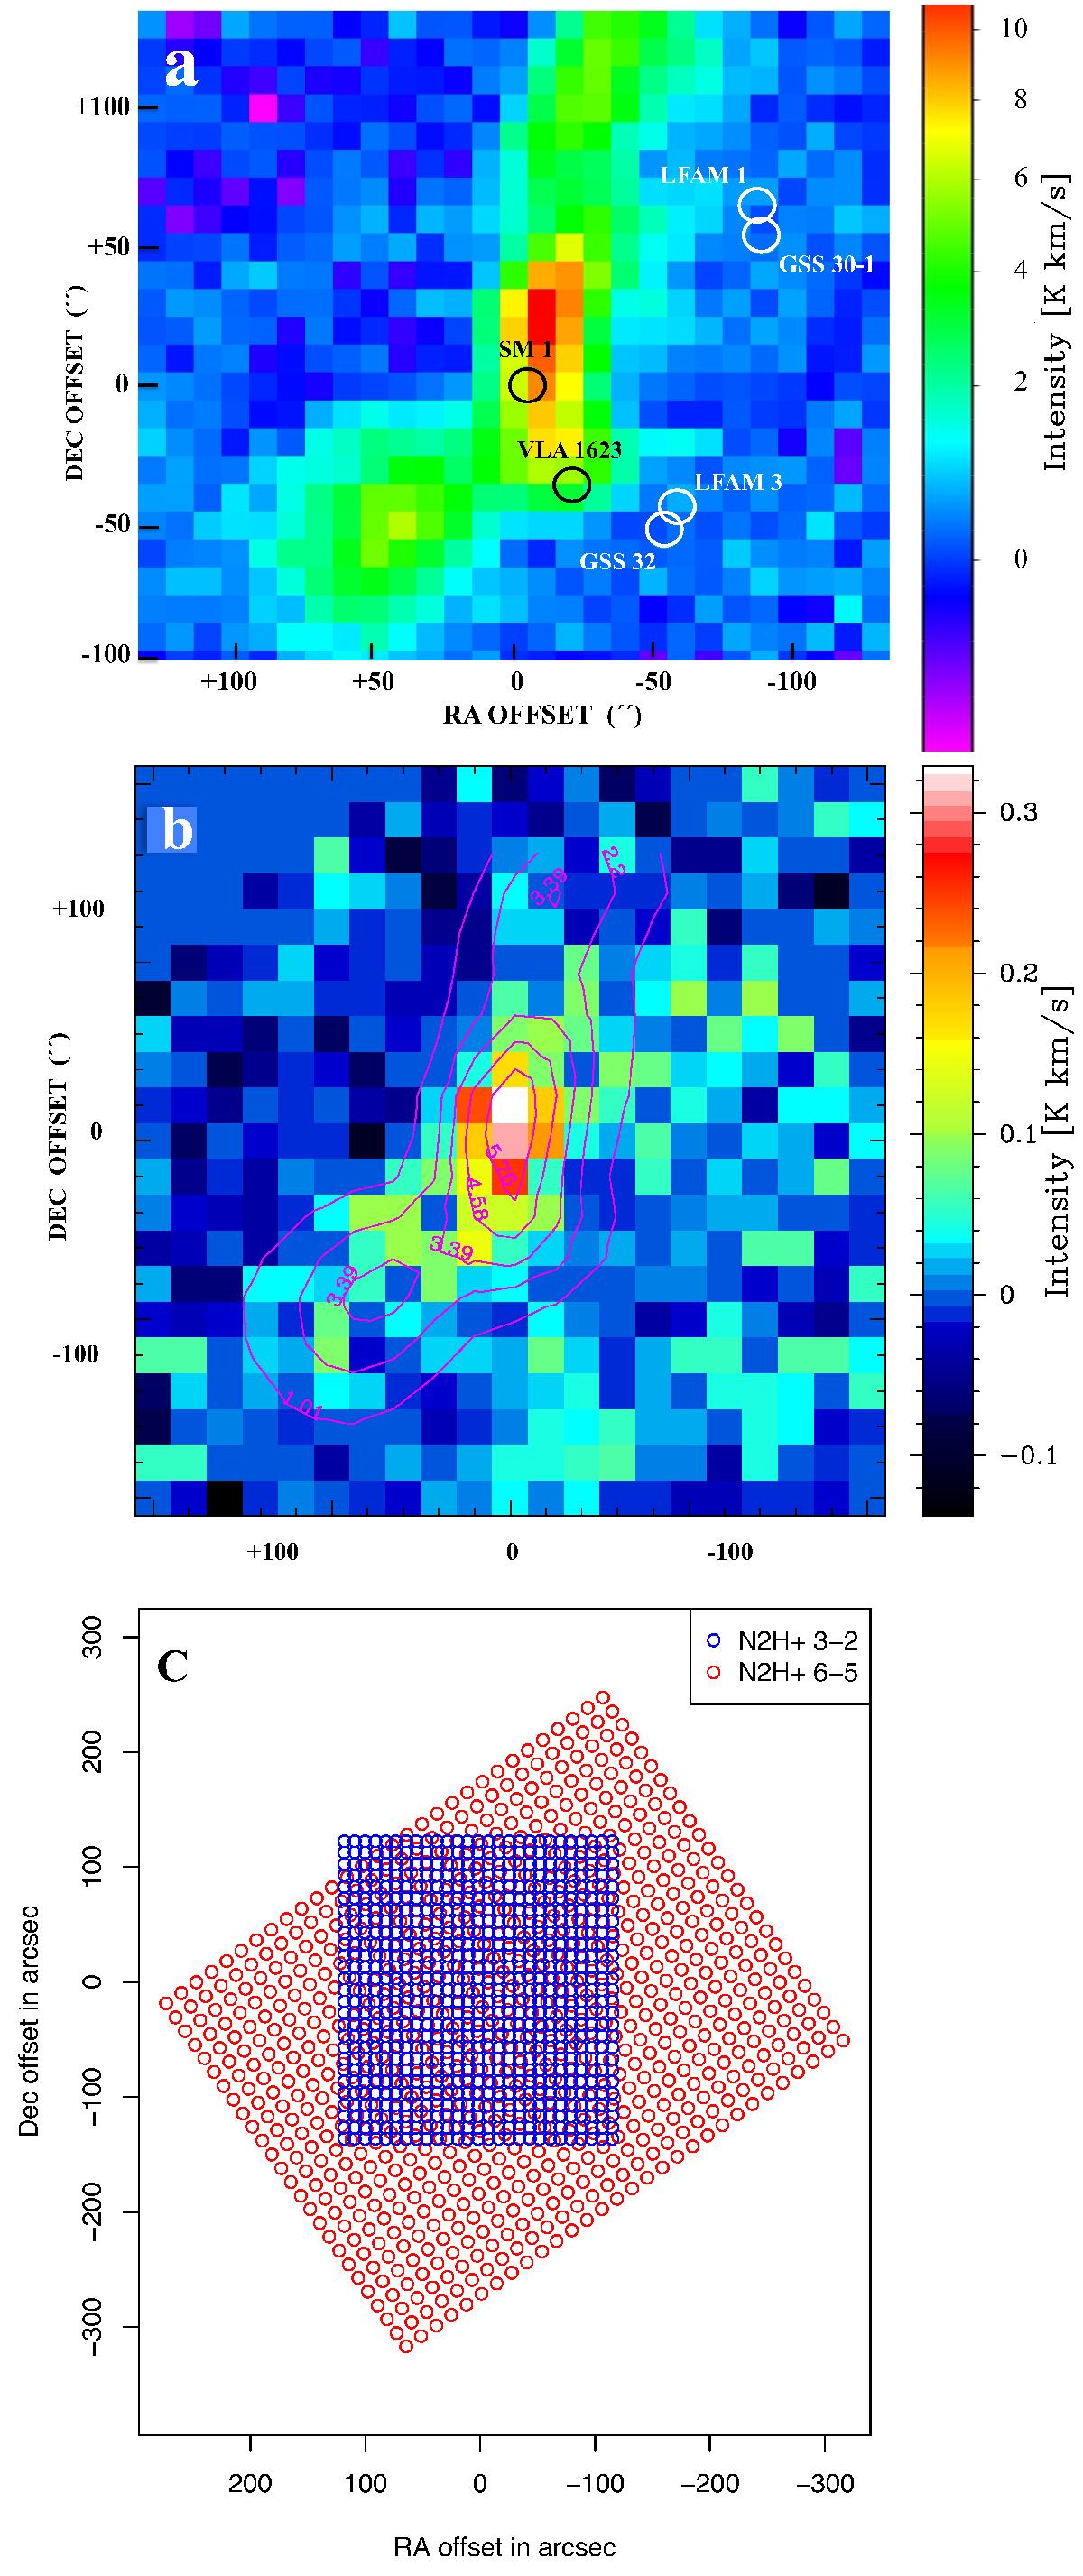
a) Integrated intensity, ![]() , of N2H+ (3–2) at 22′′ resolution with APEX and with a sampling rate of 10′′/pixel is shown in the upper panel. The positions of the SED-class sources of Fig. 1 are shown with their proper designations. b) Herschel map of the ρ Oph A core in the N2H+ (6–5) line that is rotated to align with the APEX data. The (6–5) map has a resolution of 38′′ and is sampled at a rate of 16′′/pixel. Superposed, and shown as contours, is the map in the (3–2) line at degraded resolution. c) Orientation of the maps in the sky.
, of N2H+ (3–2) at 22′′ resolution with APEX and with a sampling rate of 10′′/pixel is shown in the upper panel. The positions of the SED-class sources of Fig. 1 are shown with their proper designations. b) Herschel map of the ρ Oph A core in the N2H+ (6–5) line that is rotated to align with the APEX data. The (6–5) map has a resolution of 38′′ and is sampled at a rate of 16′′/pixel. Superposed, and shown as contours, is the map in the (3–2) line at degraded resolution. c) Orientation of the maps in the sky.
Current usage metrics show cumulative count of Article Views (full-text article views including HTML views, PDF and ePub downloads, according to the available data) and Abstracts Views on Vision4Press platform.
Data correspond to usage on the plateform after 2015. The current usage metrics is available 48-96 hours after online publication and is updated daily on week days.
Initial download of the metrics may take a while.