Fig. 18
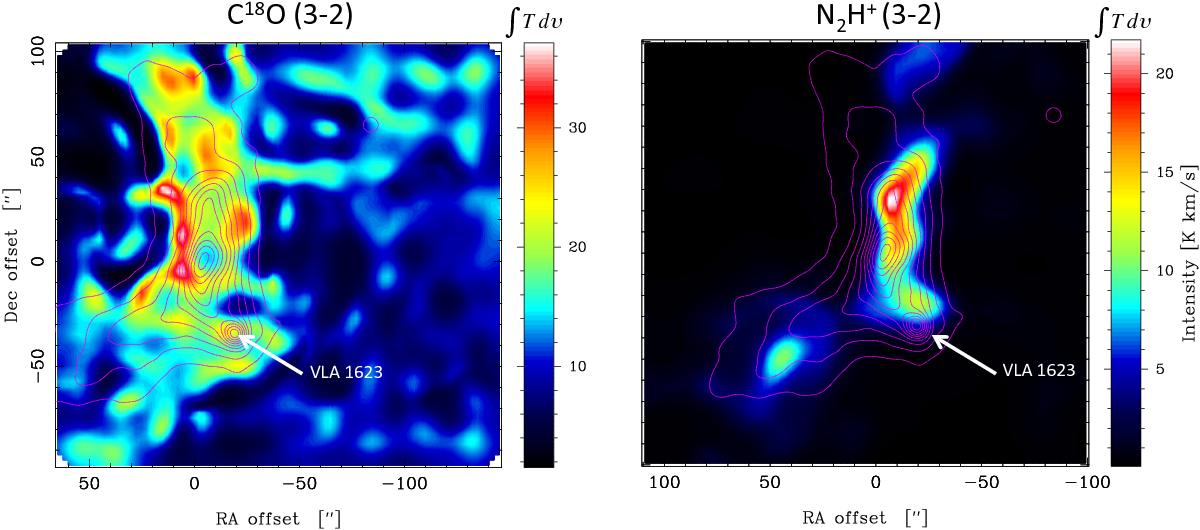
Left: C18O (3–2) map at 850 μm, deconvolved to the same resolution (7′′) as that of the SABOCA 350 μm continuum data, shown as contours (from 2.5 to 30 in increments of 2.5 Jy/beam). The Class 0 source VLA 1623 is clearly present in both the line and the continuum data. Right: same as the left frame, but for N2H+ (3–2) line and 350 μm continuum radiation. The colour coding of the line intensity is given by the bar next to each image.
Current usage metrics show cumulative count of Article Views (full-text article views including HTML views, PDF and ePub downloads, according to the available data) and Abstracts Views on Vision4Press platform.
Data correspond to usage on the plateform after 2015. The current usage metrics is available 48-96 hours after online publication and is updated daily on week days.
Initial download of the metrics may take a while.