Fig. 16
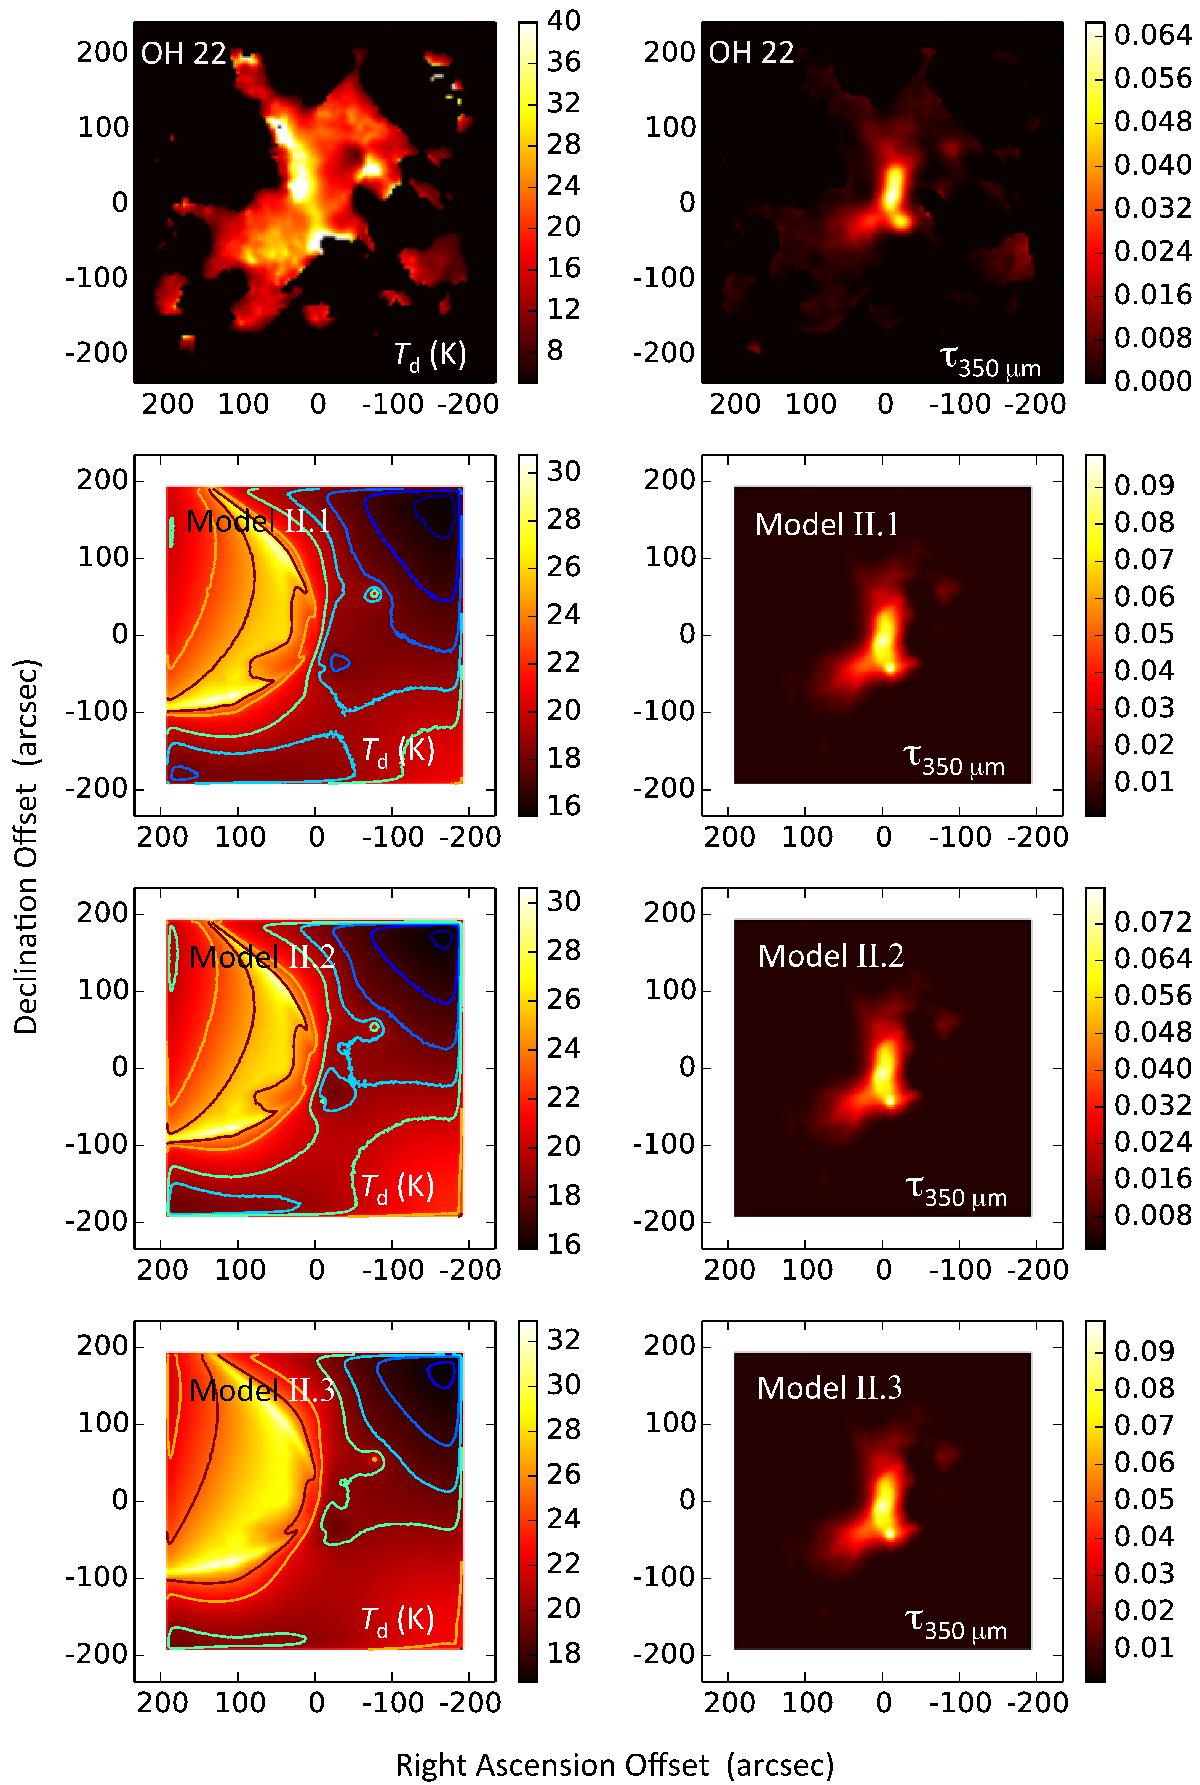
Distributions of dust temperature (left) and 350 μm optical depth (right). Top: 1D model using opacity curve No. 22 of Ossenkopf & Henning (1994, Table B.1), where β = 1.89. Second from above: 3D model (cf. Fig. 13) accounting for gradients in the core and using a slightly modified curve No. 22 with β = 1.99 (model II.1). The contours correspond to 16, 17, 18, 19, 20, 25, and 30 K. Second from below: same 3D model geometry, but with the opacity curve of Zubko et al. (2004) that includes PAHs and for β = 2.1 (model II.2, see the text). Bottom: model II.3 has the same geometry as before, but uses opacities from Weingartner & Draine (2001) for RV = 5.5 and PAHs (see Fig. 13).
Current usage metrics show cumulative count of Article Views (full-text article views including HTML views, PDF and ePub downloads, according to the available data) and Abstracts Views on Vision4Press platform.
Data correspond to usage on the plateform after 2015. The current usage metrics is available 48-96 hours after online publication and is updated daily on week days.
Initial download of the metrics may take a while.