Fig. 15
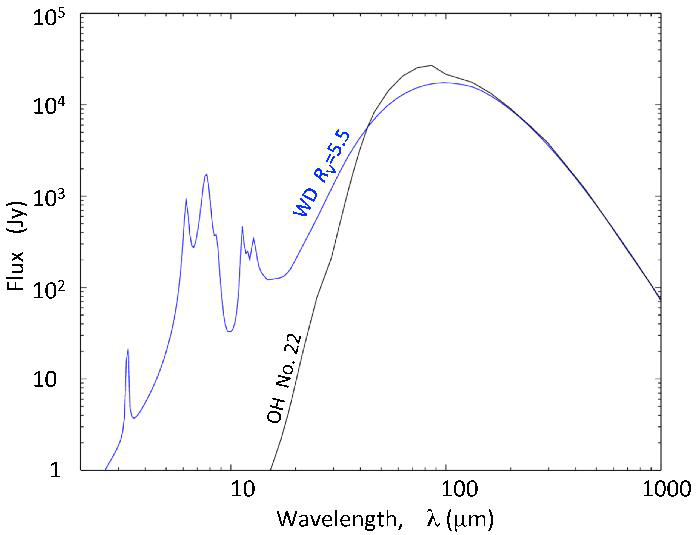
SEDs of ρ Oph A. For models II.1 (black) and II.3 (blue), the emerging specific intensity has been integrated over the core ρ Oph A that is displayed in Fig. 13d. The thermal equilibrium model II.1 uses the extinction curve as modified by Ossenkopf & Henning (1994). The non-equilibrium model II.3 uses that of Weingartner & Draine (2001) for RV = 5.5, which includes the PAHs, and where by comparison, the 100 and 160 μm fluxes are reduced.
Current usage metrics show cumulative count of Article Views (full-text article views including HTML views, PDF and ePub downloads, according to the available data) and Abstracts Views on Vision4Press platform.
Data correspond to usage on the plateform after 2015. The current usage metrics is available 48-96 hours after online publication and is updated daily on week days.
Initial download of the metrics may take a while.