Fig. 14
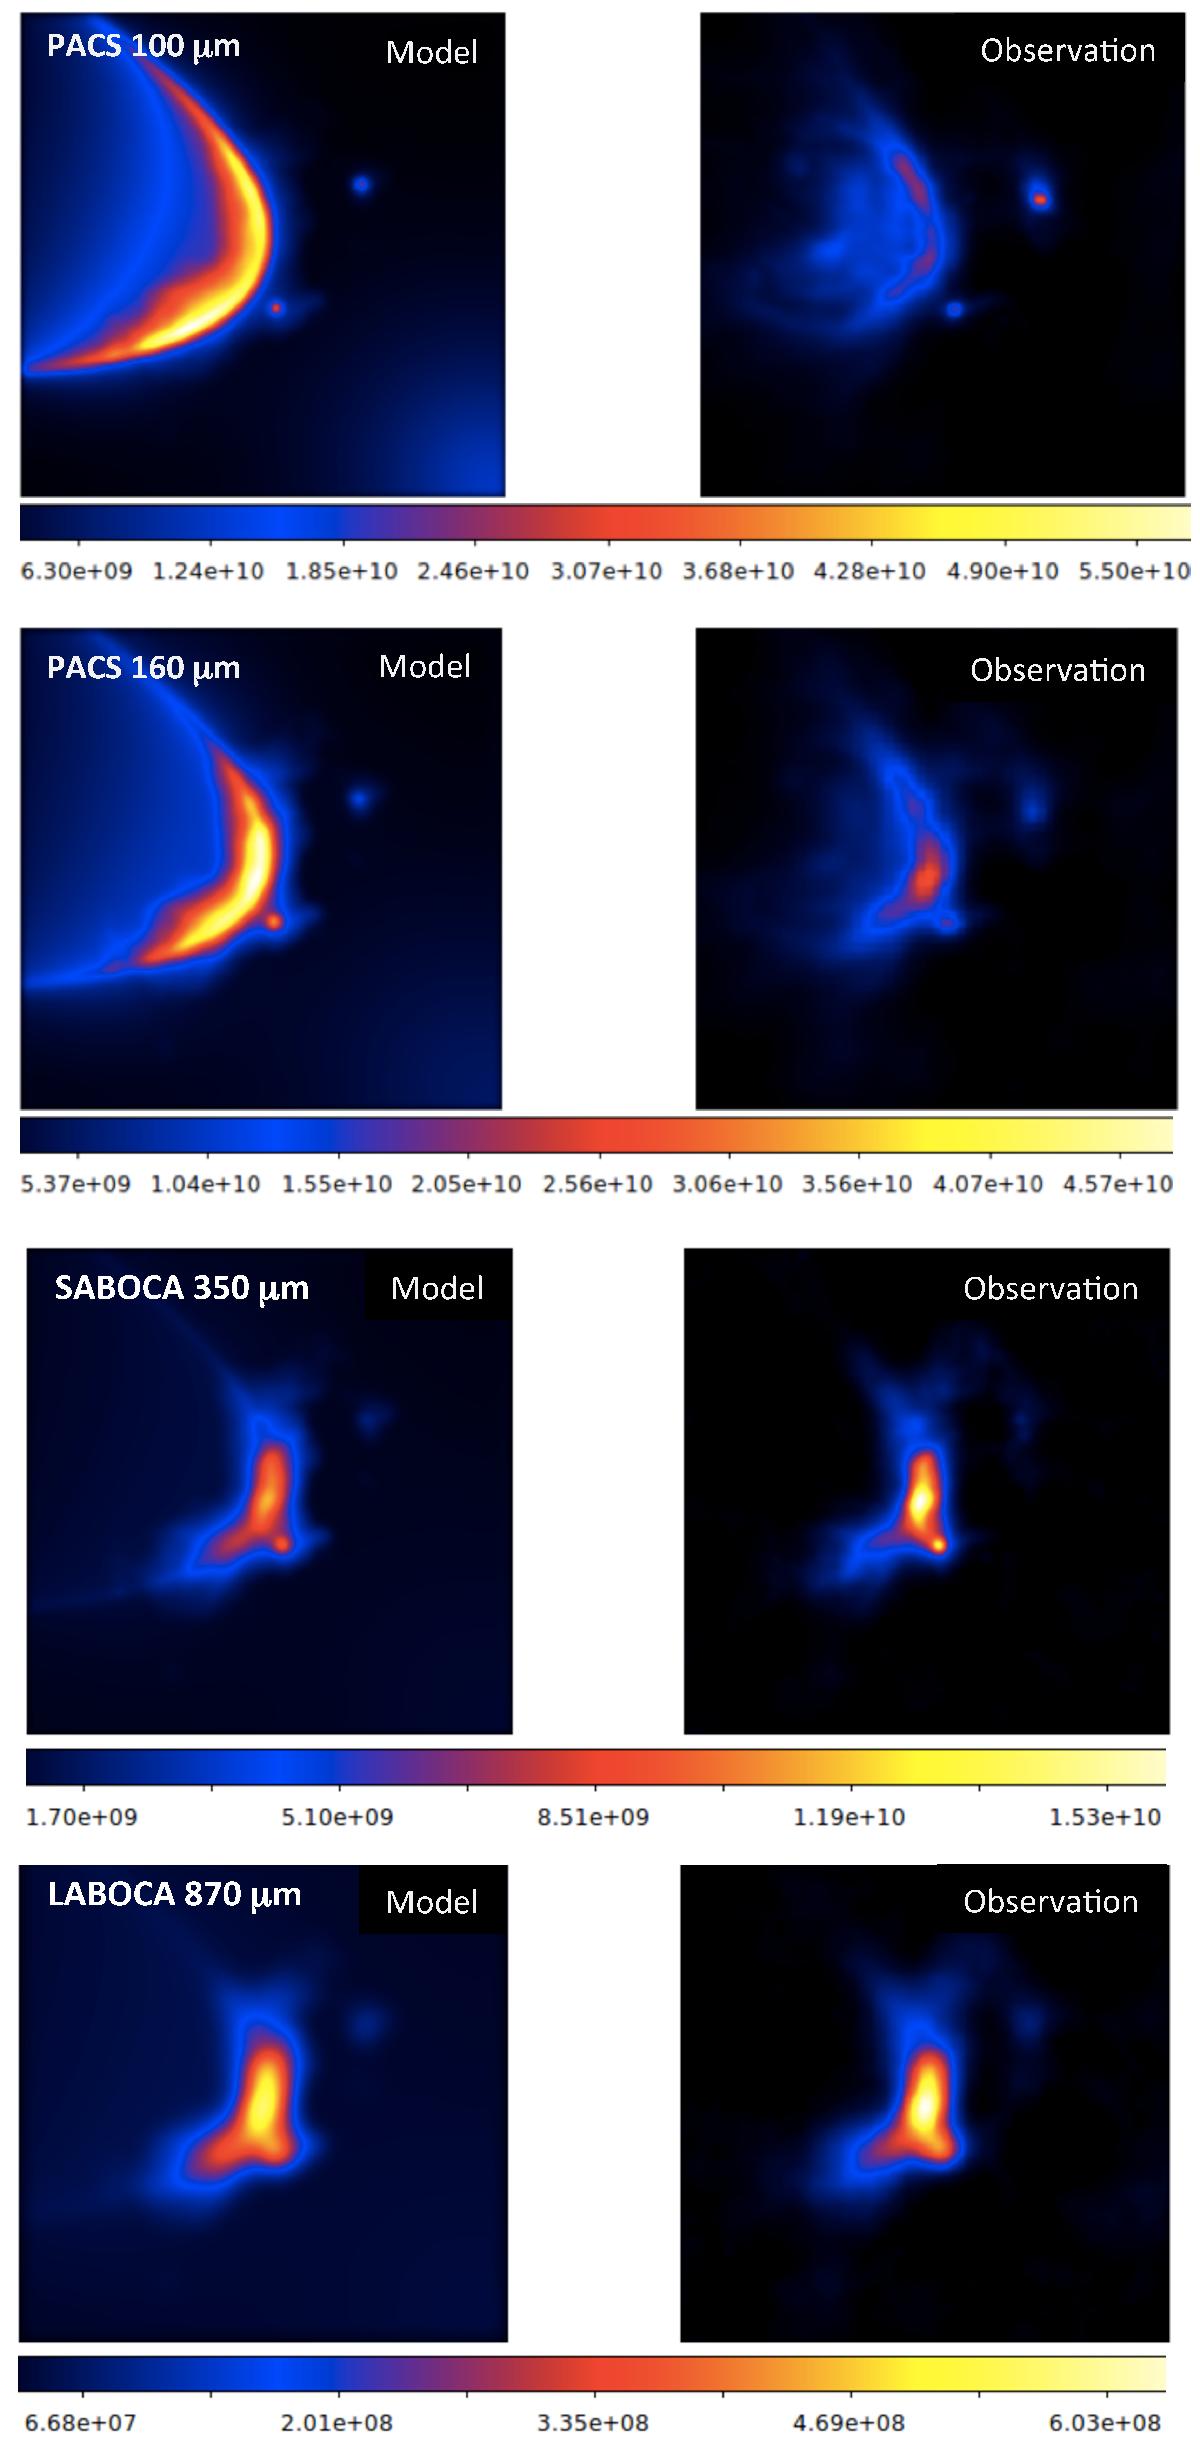
Results from model II.1, comparing modelling results (left) with the observations (right). From top to bottom PACS 100 μm, PACS 160 μm, SABOCA 350 μm, and LABOCA 870 μm, where intensity units are Jy sr-1. Including the PAH opacities did not improve the models at the FIR wavelengths, where the models over-predict the intensities observed by Herschel. In contrast, the agreement between models and APEX observations in the submm is very satisfactory, within better than 20%.
Current usage metrics show cumulative count of Article Views (full-text article views including HTML views, PDF and ePub downloads, according to the available data) and Abstracts Views on Vision4Press platform.
Data correspond to usage on the plateform after 2015. The current usage metrics is available 48-96 hours after online publication and is updated daily on week days.
Initial download of the metrics may take a while.