Fig. 12
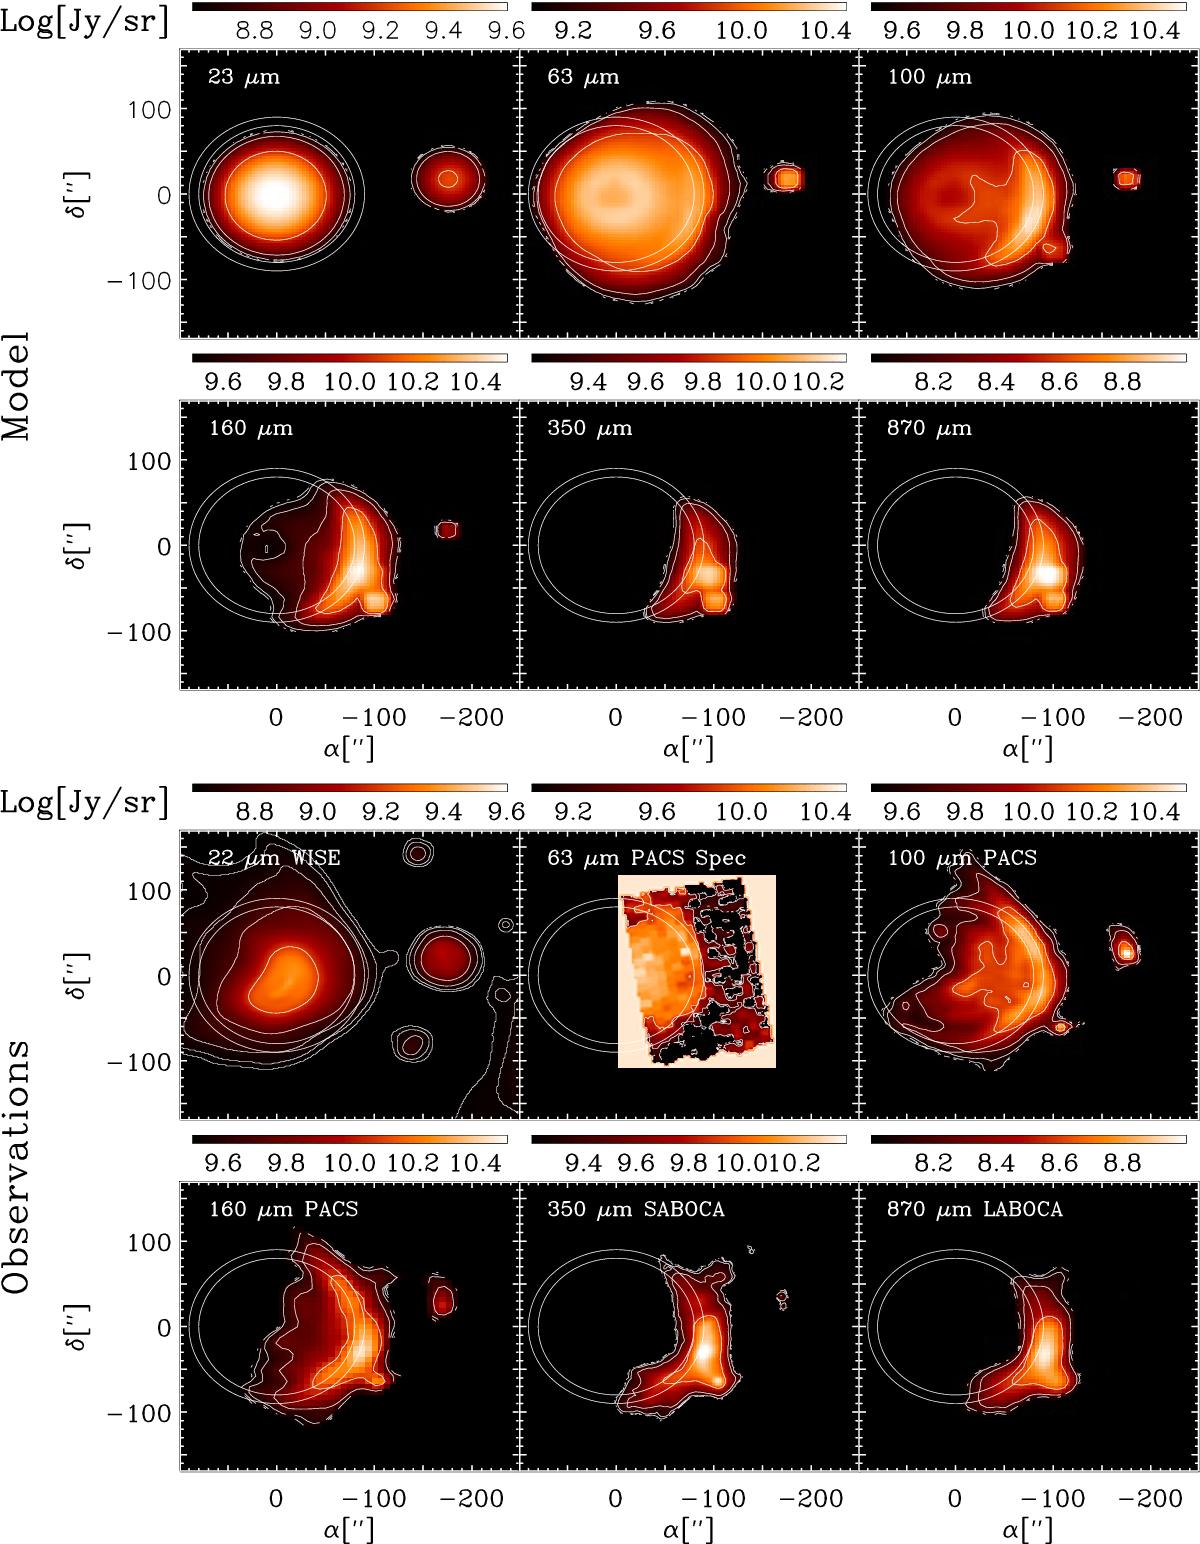
Top panels: synthetic images of ρ Oph A that were generated from the results of model I. Continuum wavelengths are 22, 63, 100, 160, 350, and 870 μm. The logarithmic scales are in units of Jy sr-1 and given along the colour bars atop each frame. Bottom panels: displayed observations taken from WISE (22 μm), Herschel-PACS (63, 100 and 160 μm), and APEX (350 and 870 μm).
Current usage metrics show cumulative count of Article Views (full-text article views including HTML views, PDF and ePub downloads, according to the available data) and Abstracts Views on Vision4Press platform.
Data correspond to usage on the plateform after 2015. The current usage metrics is available 48-96 hours after online publication and is updated daily on week days.
Initial download of the metrics may take a while.