Fig. 10
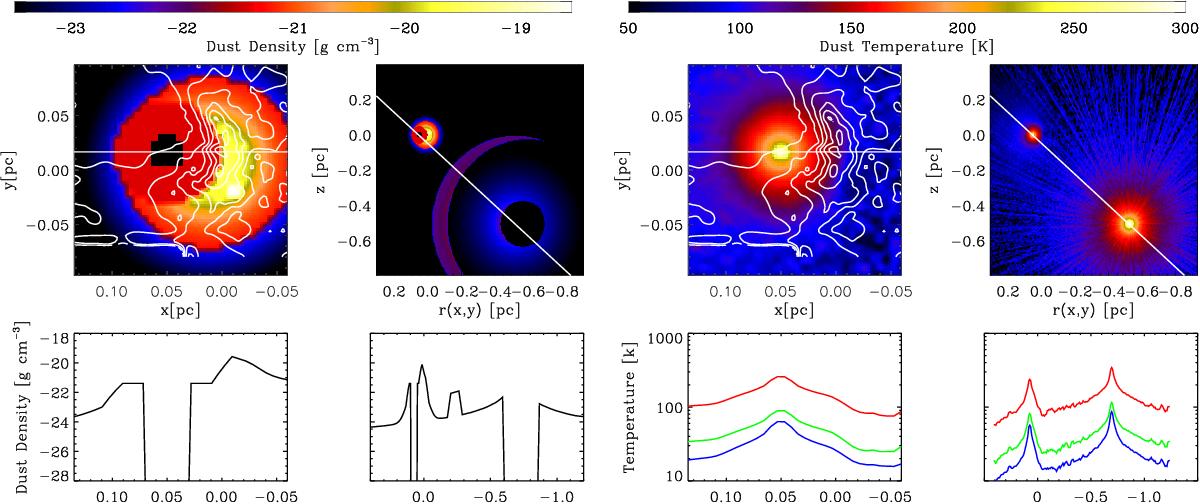
Left panels: density distribution of model I. With the logarithmic colour bars on top, a 2D distribution is shown to the left that lies in a plane containing the star S 1 and the centre of the main core SM 1, and to the right the entire model, also containing HD 147889. The panels below show the cuts along the straight white lines. White contours refer to the C18O (3−2) measurements by Liseau et al. (2010). Right panel: resulting temperature distribution of model I, with similar format as for the density distribution. The different colours in the frames below refer to the temperatures of the various dust constituents. Red: Very small grains (VSGs) and polycyclic aromatic hydrocarbons (PAHs). Green: grains with sizes between 0.03−3 μm. Blue: grains whose sizes extend up to 300 μm.
Current usage metrics show cumulative count of Article Views (full-text article views including HTML views, PDF and ePub downloads, according to the available data) and Abstracts Views on Vision4Press platform.
Data correspond to usage on the plateform after 2015. The current usage metrics is available 48-96 hours after online publication and is updated daily on week days.
Initial download of the metrics may take a while.