Fig. 1
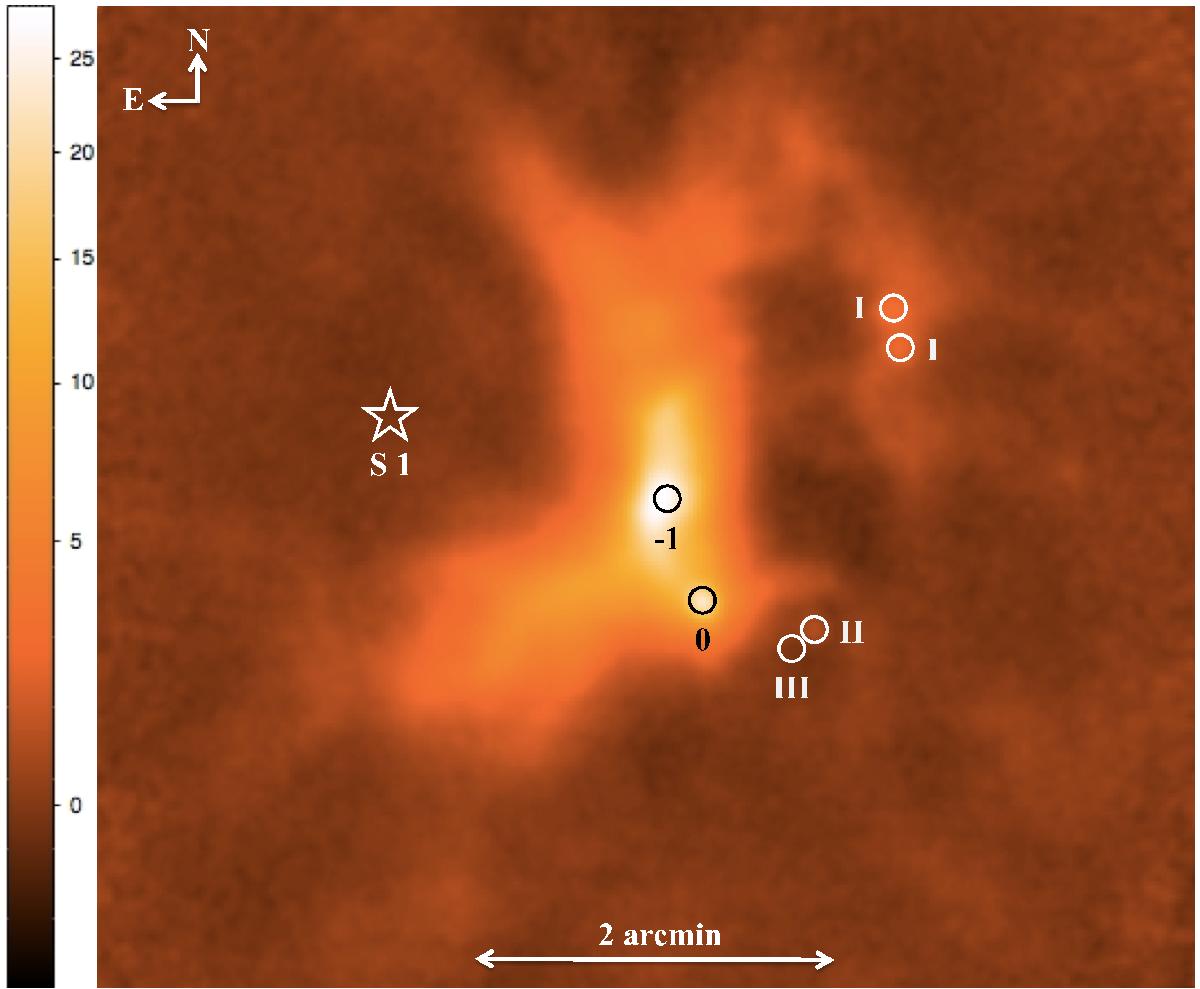
Core ρ Oph A in the continuum at 350 μm, where the different evolutionary phases are identified. The position of the dominating radiative source S 1 is shown by the star symbol. The colour scale is in units of Jy beam-1, with the circles corresponding to the beam size. The angular scale is shown at the bottom of the figure and the orientation in the sky in the upper left corner. The APEX maps of this paper have their origin at RA = 16h26m27![]() 90, Dec = −24°23′57
90, Dec = −24°23′57![]() 00 (J2000.0).
00 (J2000.0).
Current usage metrics show cumulative count of Article Views (full-text article views including HTML views, PDF and ePub downloads, according to the available data) and Abstracts Views on Vision4Press platform.
Data correspond to usage on the plateform after 2015. The current usage metrics is available 48-96 hours after online publication and is updated daily on week days.
Initial download of the metrics may take a while.