Fig. 9
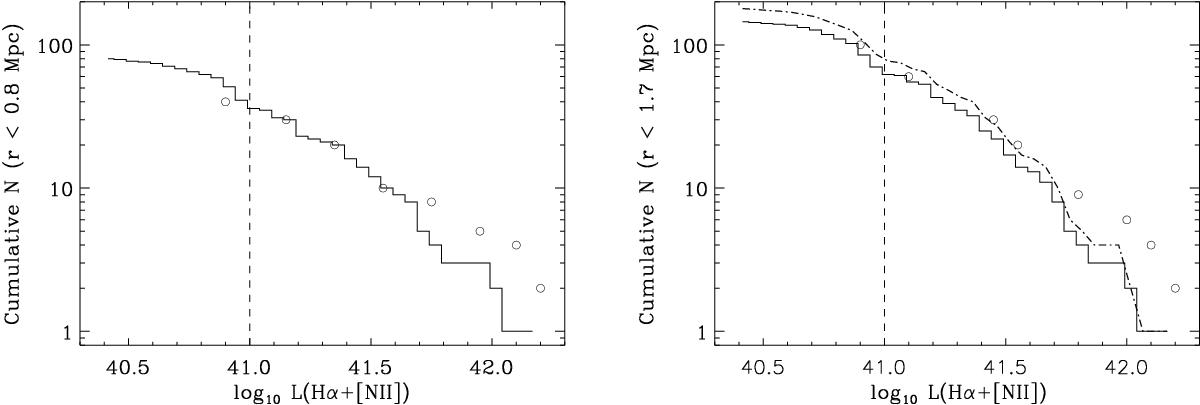
Cumulative luminosity function (LF) within a radius of 0.8 Mpc (left) and rvir = 1.7 Mpc (right). The solid line corresponds to our galaxy counts, and the big open circles are sparsely sampled points from the Kodama et al. (2004) LF. The dotted-dashed line in the right plot corresponds to our LF corrected for the incomplete area coverage within rvir. The dashed line corresponds to the completeness limit of our data, log L(Hα+[N ii]) ≃ 41.
Current usage metrics show cumulative count of Article Views (full-text article views including HTML views, PDF and ePub downloads, according to the available data) and Abstracts Views on Vision4Press platform.
Data correspond to usage on the plateform after 2015. The current usage metrics is available 48-96 hours after online publication and is updated daily on week days.
Initial download of the metrics may take a while.