Fig. 8
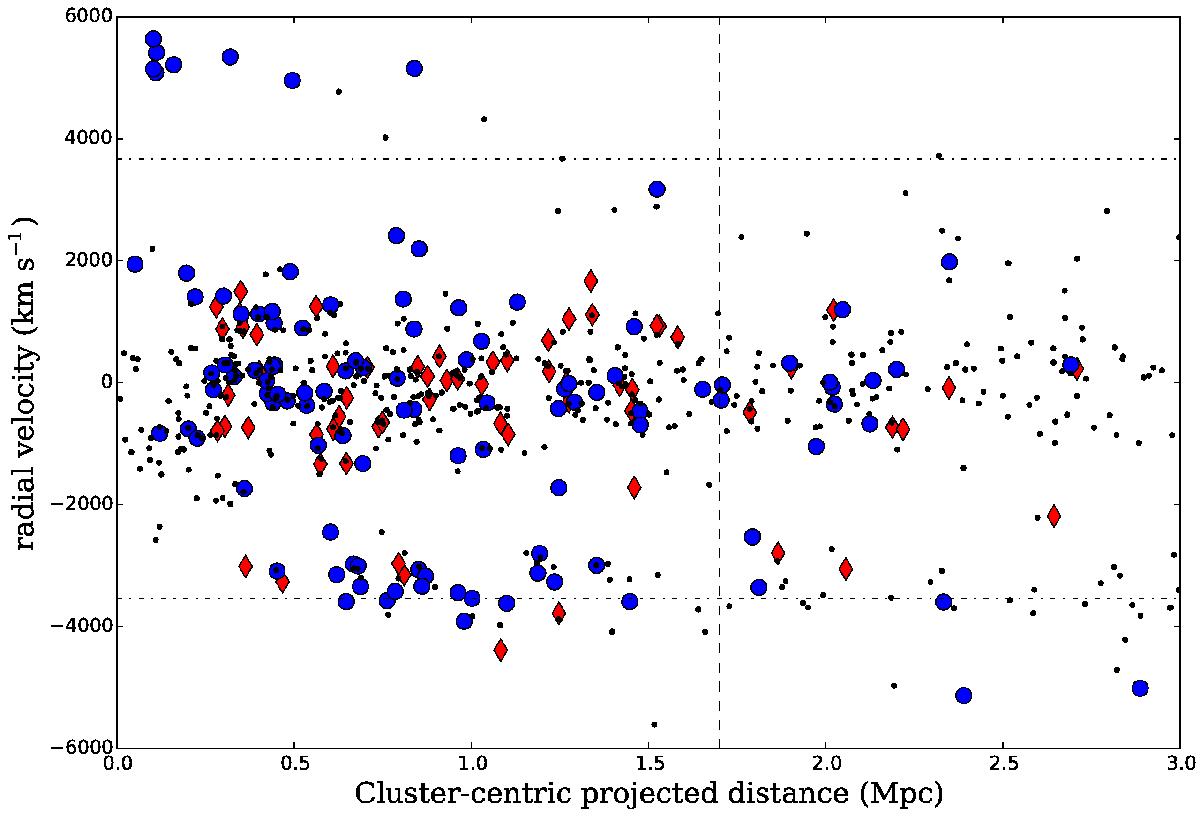
Line-of-sight velocity relative to the cluster main component central redshift z = 0.395 plotted against the projected distance to the cluster centre (as defined by the distribution of galaxies/BCG). Red diamonds correspond to AGNs and blue dots to SF galaxies according to the H97 criterion (see Sect. 8). The dotted vertical line marks the virial radius of 1.7 Mpc (Treu et al. 2003). The dashed-dotted horizontal lines correspond to the radial velocity limits fully covered within the field of view of both OSIRIS TF pointings (see Sect. 3 and Eq. (2)). The small black points correspond to galaxies from M05 with spectroscopic redshifts, including both passive and star-forming objects.
Current usage metrics show cumulative count of Article Views (full-text article views including HTML views, PDF and ePub downloads, according to the available data) and Abstracts Views on Vision4Press platform.
Data correspond to usage on the plateform after 2015. The current usage metrics is available 48-96 hours after online publication and is updated daily on week days.
Initial download of the metrics may take a while.