Fig. 7
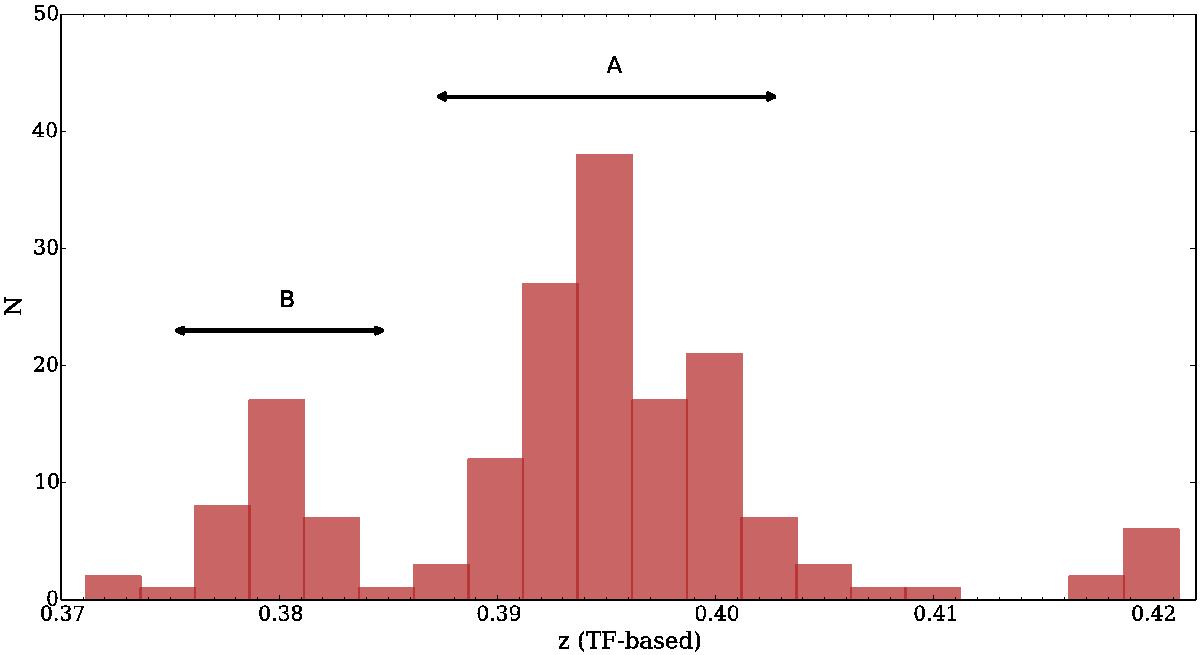
Distribution of redshifts derived from our data. It is possible to recognize two dynamical structures as in Czoske et al. (2002): “A” is the main cluster component, while “B” lies along the line of sight to the cluster centre and has been interpreted as an infalling group at high velocity.
Current usage metrics show cumulative count of Article Views (full-text article views including HTML views, PDF and ePub downloads, according to the available data) and Abstracts Views on Vision4Press platform.
Data correspond to usage on the plateform after 2015. The current usage metrics is available 48-96 hours after online publication and is updated daily on week days.
Initial download of the metrics may take a while.