Fig. 2
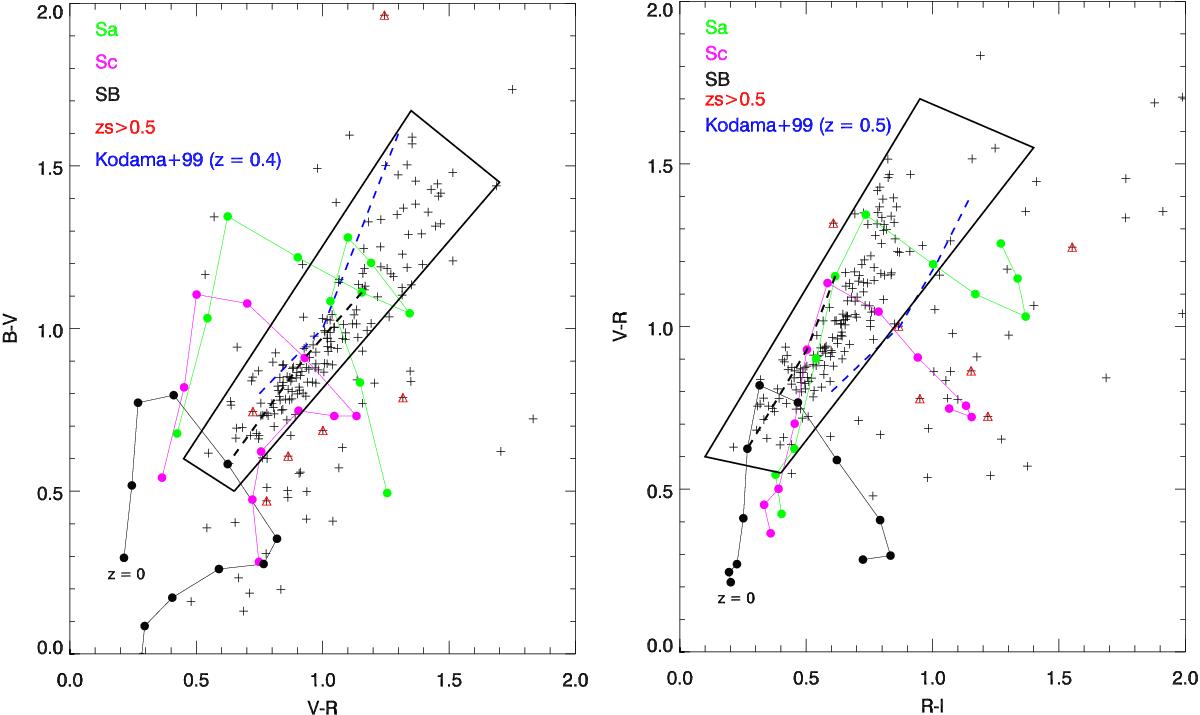
B − V vs. V − R (left) and V − R vs. R − I (right) diagnostic diagrams. The sample, comprising 202 unique objects with counterparts in the M05 catalogue is denoted by crosses (+). The red triangles (△) denote objects with spectroscopic redshift zs> 0.5 in the M05 catalogue. The control grid has been built using synthetic colours from COSMOS templates for Sa, Sc, and SB galaxies in the range z = 0.0−1.0 with steps of Δz = 0.1. The thick black dashed line connects the three templates at z = 0.4. The blue dashed line depicts the Kodama et al. (1999) models at z = 0.4 and z = 0.5. The thick black solid line box marks the approximate region used for selecting the cluster candidates.
Current usage metrics show cumulative count of Article Views (full-text article views including HTML views, PDF and ePub downloads, according to the available data) and Abstracts Views on Vision4Press platform.
Data correspond to usage on the plateform after 2015. The current usage metrics is available 48-96 hours after online publication and is updated daily on week days.
Initial download of the metrics may take a while.