Fig. 13
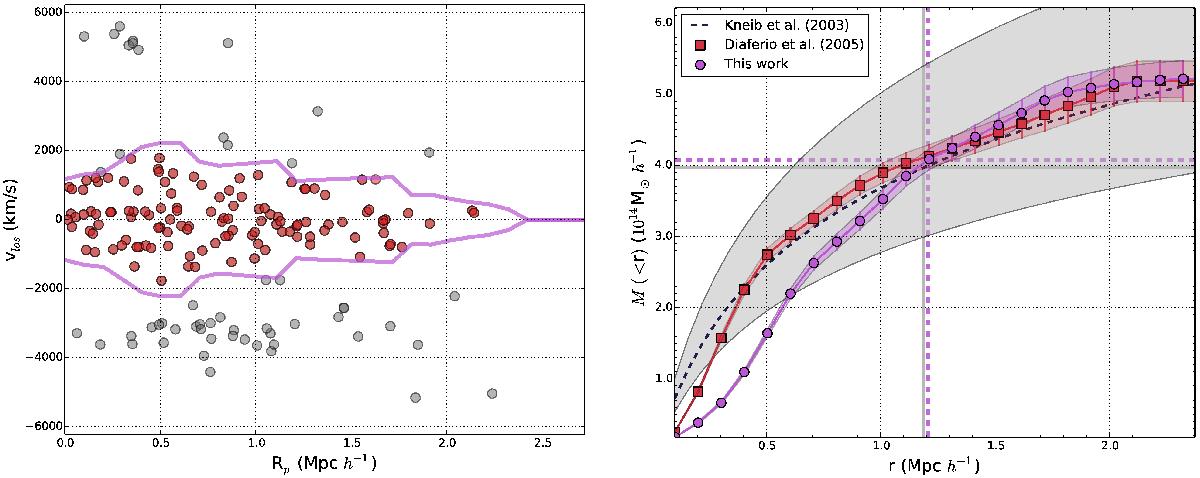
Left: redshift diagram showing the selected cluster members (red dots, coincident with those in the main structure identified in Sect. 6) and the caustics (purple solid lines). Right: caustic-ELG mass profile (purple circles) computed by integrating the squared caustic amplitude profile; NFW-best-fit mass profile to the weak-lensing mass from Kneib et al. (2003; black dashed line); caustic analysis of the catalog from Diaferio et al. (2005; red squares). The vertical and horizontal lines are M200 and r200 of the caustic-ELG (purple) and weak-lensing (grey) mass profiles.
Current usage metrics show cumulative count of Article Views (full-text article views including HTML views, PDF and ePub downloads, according to the available data) and Abstracts Views on Vision4Press platform.
Data correspond to usage on the plateform after 2015. The current usage metrics is available 48-96 hours after online publication and is updated daily on week days.
Initial download of the metrics may take a while.