Fig. 12
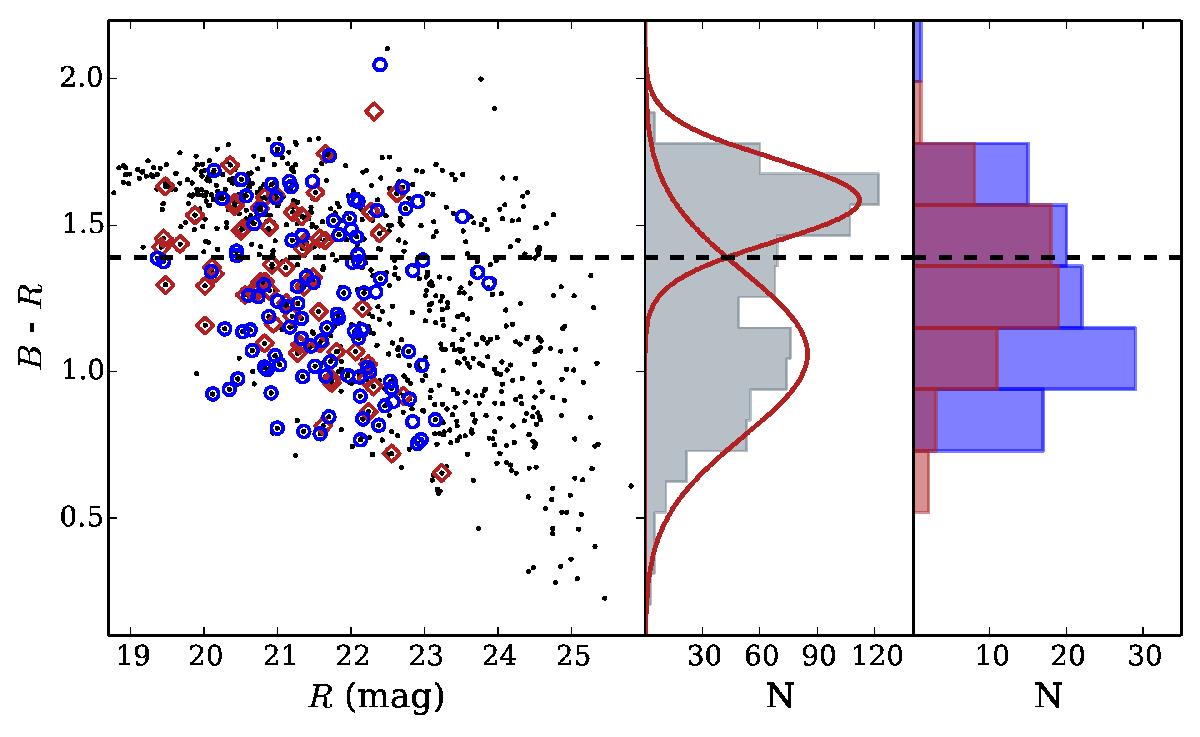
Left: B − R vs. R colour−magnitude diagram. The AGN are represented by red diamond symbols, while blue circles are SF galaxies. The black dots represent the cluster control sample from M05. The dashed line corresponds to the separation between the red sequence and blue cloud populations (see text). Middle: histogram of the control sample. The bi-modality of the distribution of optical colours is evident. The red curves are the best Gaussian fits to the distribution. Right: colour histograms for AGNs (red) and SF (blue) galaxies. It is likely that both populations are drawn from different distributions.
Current usage metrics show cumulative count of Article Views (full-text article views including HTML views, PDF and ePub downloads, according to the available data) and Abstracts Views on Vision4Press platform.
Data correspond to usage on the plateform after 2015. The current usage metrics is available 48-96 hours after online publication and is updated daily on week days.
Initial download of the metrics may take a while.