Fig. 1
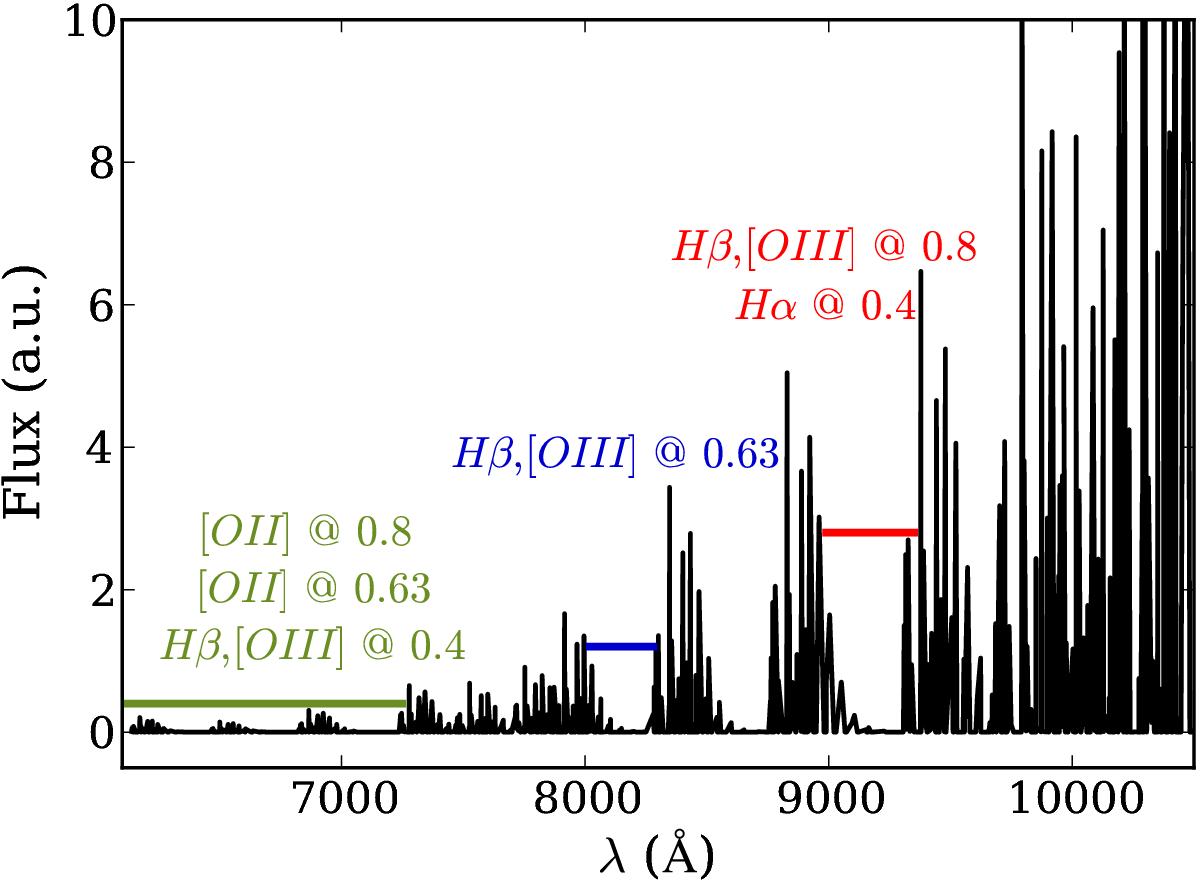
Night sky spectrum from Rousselot et al. (2000) and GLACE windows within the OH bands. The locii of the strongest rest-frame emission lines at different redshifts are shown next to the corresponding spectral windows. The observations within this paper have been performed within the Hα window at z = 0.4.
Current usage metrics show cumulative count of Article Views (full-text article views including HTML views, PDF and ePub downloads, according to the available data) and Abstracts Views on Vision4Press platform.
Data correspond to usage on the plateform after 2015. The current usage metrics is available 48-96 hours after online publication and is updated daily on week days.
Initial download of the metrics may take a while.