Fig. 5
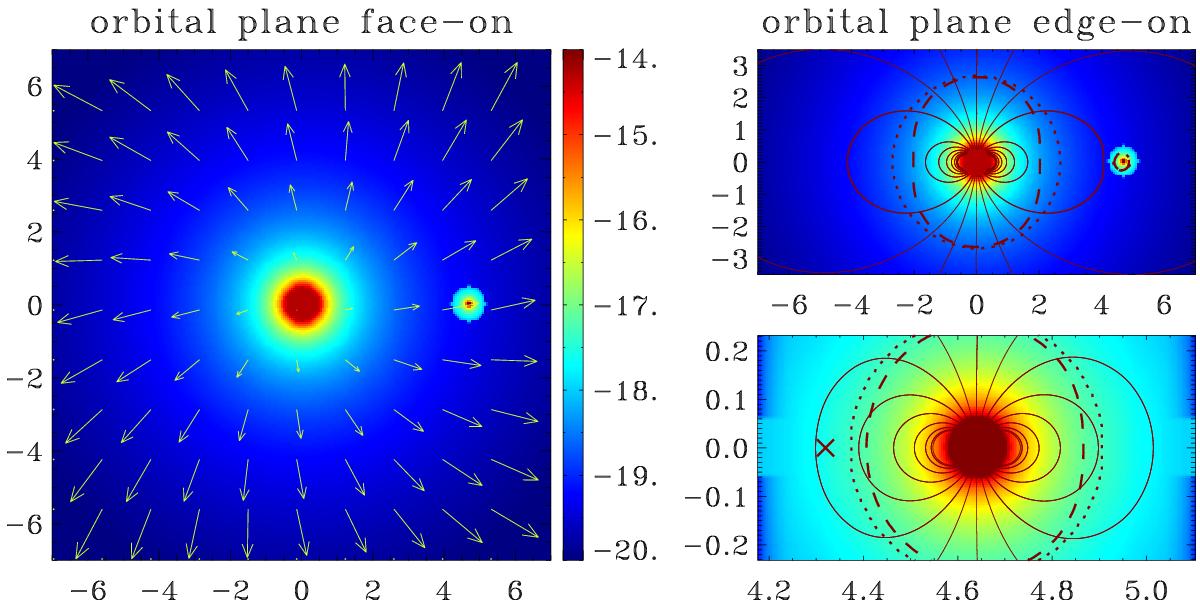
Initial conditions in the lab frame for model FVRB. The axes are in units of 0.01 AU. Logarithmic density contours (in units of g cm-3) are shown in the x-y plane (z = 0; left panel) and in the x-z plane (y = 0; right panels). The top right panel is focused on the star and the bottom right on the planet. Solid lines represent the magnetic field, arrows show the velocity field (with the longest one corresponding to ~290 km s-1), dashed lines the poloidal Alfvén surface (![]() ), and dotted lines the poloidal sonic surface (
), and dotted lines the poloidal sonic surface (![]() ). The cross in the bottom right panel denotes the location of the L1 point.
). The cross in the bottom right panel denotes the location of the L1 point.
Current usage metrics show cumulative count of Article Views (full-text article views including HTML views, PDF and ePub downloads, according to the available data) and Abstracts Views on Vision4Press platform.
Data correspond to usage on the plateform after 2015. The current usage metrics is available 48-96 hours after online publication and is updated daily on week days.
Initial download of the metrics may take a while.