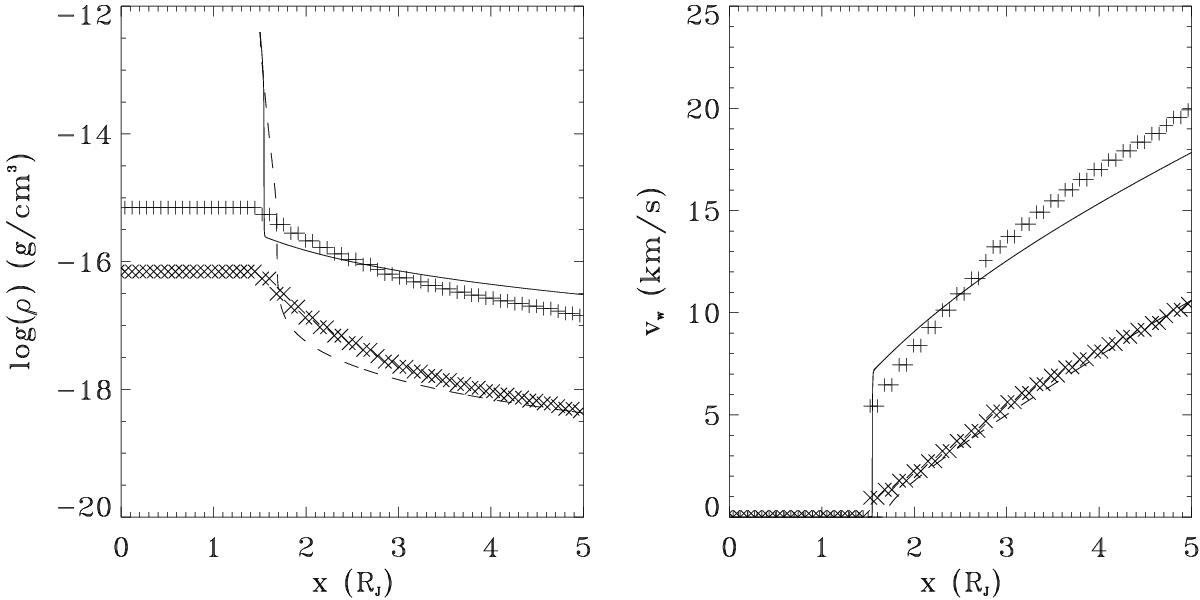
Fig. 3

Logarithmic density (left) and radial velocity (right) as a function of distance from the planet’s center for the isotropic outflow model used to initialize the 3D wind simulation for a “light” hot Jupiter (M° = 0.5 MJ, R° = 1.5 RJ). The symbols “+” and “×” denote, respectively, the high- and low-flux cases (modeled with T° = 104 K and T° = 6 × 10³ K, respectively). The solid and dashed lines are from the corresponding 1D simulations that take into account the relevant heating and cooling processes (see text for details).
Current usage metrics show cumulative count of Article Views (full-text article views including HTML views, PDF and ePub downloads, according to the available data) and Abstracts Views on Vision4Press platform.
Data correspond to usage on the plateform after 2015. The current usage metrics is available 48-96 hours after online publication and is updated daily on week days.
Initial download of the metrics may take a while.


