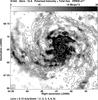
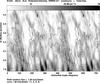
Fig. 15

Left: polarized emission (contours) at λ20.1 cm at 51′′ resolution, overlaid on a greyscale map of the surface density of the total neutral gas at 55′′ resolution (Crosthwaite et al. 2001) in sky coordinates. Right: the same quantity plotted in polar coordinates (azimuthal angle measured counterclockwise from the north-eastern major axis in the galaxy plane and ln of the radius in arcminutes); the range of azimuthal angles is plotted twice in the right panel for better visibility of the spiral arms.
Current usage metrics show cumulative count of Article Views (full-text article views including HTML views, PDF and ePub downloads, according to the available data) and Abstracts Views on Vision4Press platform.
Data correspond to usage on the plateform after 2015. The current usage metrics is available 48-96 hours after online publication and is updated daily on week days.
Initial download of the metrics may take a while.