Fig. 7
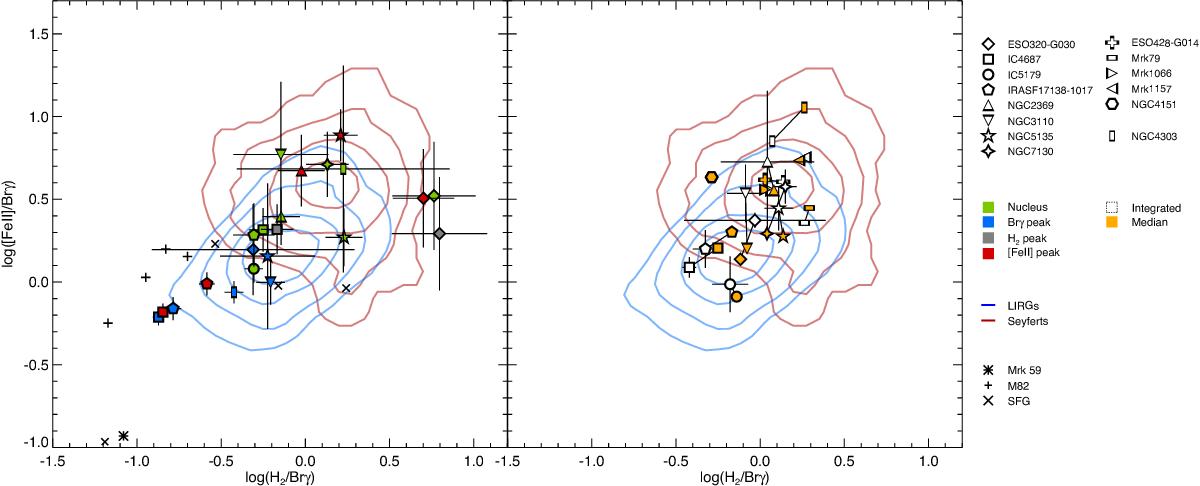
Near-IR emission line ratios for the nucleus and brightest Brγ, H2, and [FeII] emitting regions in LIRGs (left panel). Note that in some LIRGs these regions coincide (see Tables 7 and 8 for details). The distribution of spatially resolved regions (spaxel-by-spaxel) are represented by contours for both LIRGs (blue) and Seyferts (red). Contours for LIRGs and Seyferts contain 25%, 50%, 75%, and 90% of the points. Examples of nearby star-forming galaxies like M82, Mrk 59, composite AGN+stars (NGC 4303), and other low-z SFG are also indicated. The emission line ratios for the sample of LIRGs and Seyferts as derived from the integrated values (i.e. 1D flux-weighted), and median of the 2D distribution (i.e. spaxel-by-spaxel) of values is also presented (right panel).
Current usage metrics show cumulative count of Article Views (full-text article views including HTML views, PDF and ePub downloads, according to the available data) and Abstracts Views on Vision4Press platform.
Data correspond to usage on the plateform after 2015. The current usage metrics is available 48-96 hours after online publication and is updated daily on week days.
Initial download of the metrics may take a while.