Fig. 5
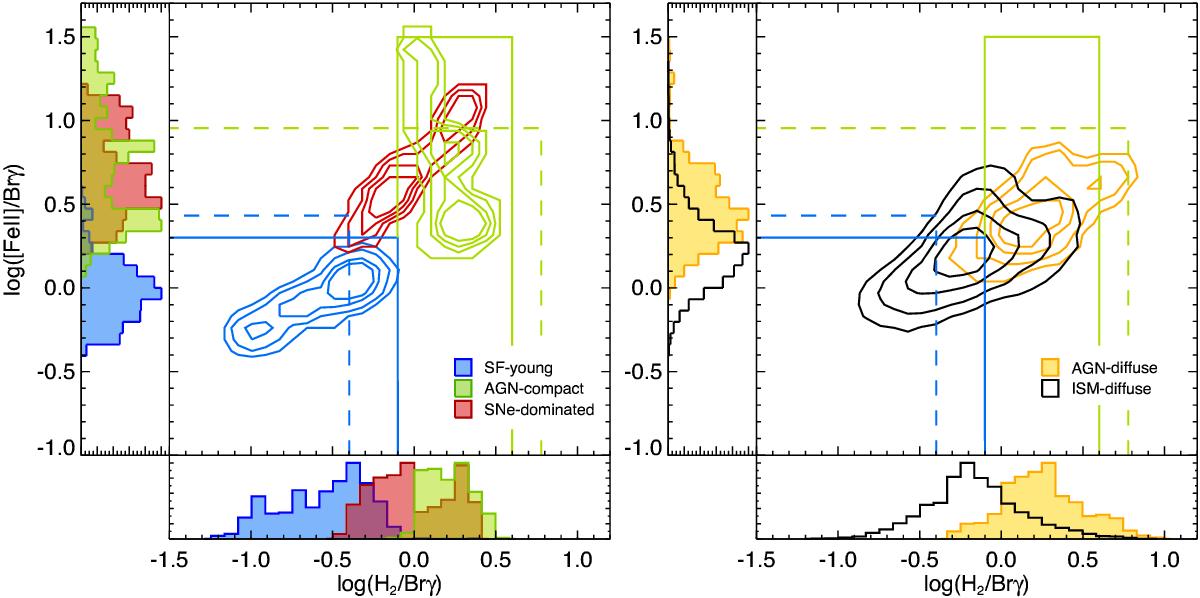
Distribution of the line ratios in the log(FeII]1.64 μm/Brγ) − log(H22.12 μm/Brγ) plane for the various types of regions identified in the three prototypes (IC 4687, NGC 7130, and NGC 5135). Left panel: compact high surface brightness young star-forming clumps (blue), aged, SNe-dominated clumps (red), compact nuclear AGN (green). Right panel: diffuse AGN (yellow), and general diffuse medium (white). The blue and green lines indicate the new upper limits for the young star-forming regions and Seyferts as derived from our spatially resolved two-dimensional spectroscopy on the high surface brightness compact regions. For comparison, the two broken lines represent the upper limits of the line ratios for the starbursts and Seyferts previously identified by Riffel and coworkers (Riffel et al. 2013a) based on 1D spectroscopy. Contours contain 25%, 50%, 75%, and 90% of the points for each class.
Current usage metrics show cumulative count of Article Views (full-text article views including HTML views, PDF and ePub downloads, according to the available data) and Abstracts Views on Vision4Press platform.
Data correspond to usage on the plateform after 2015. The current usage metrics is available 48-96 hours after online publication and is updated daily on week days.
Initial download of the metrics may take a while.