Fig. 1
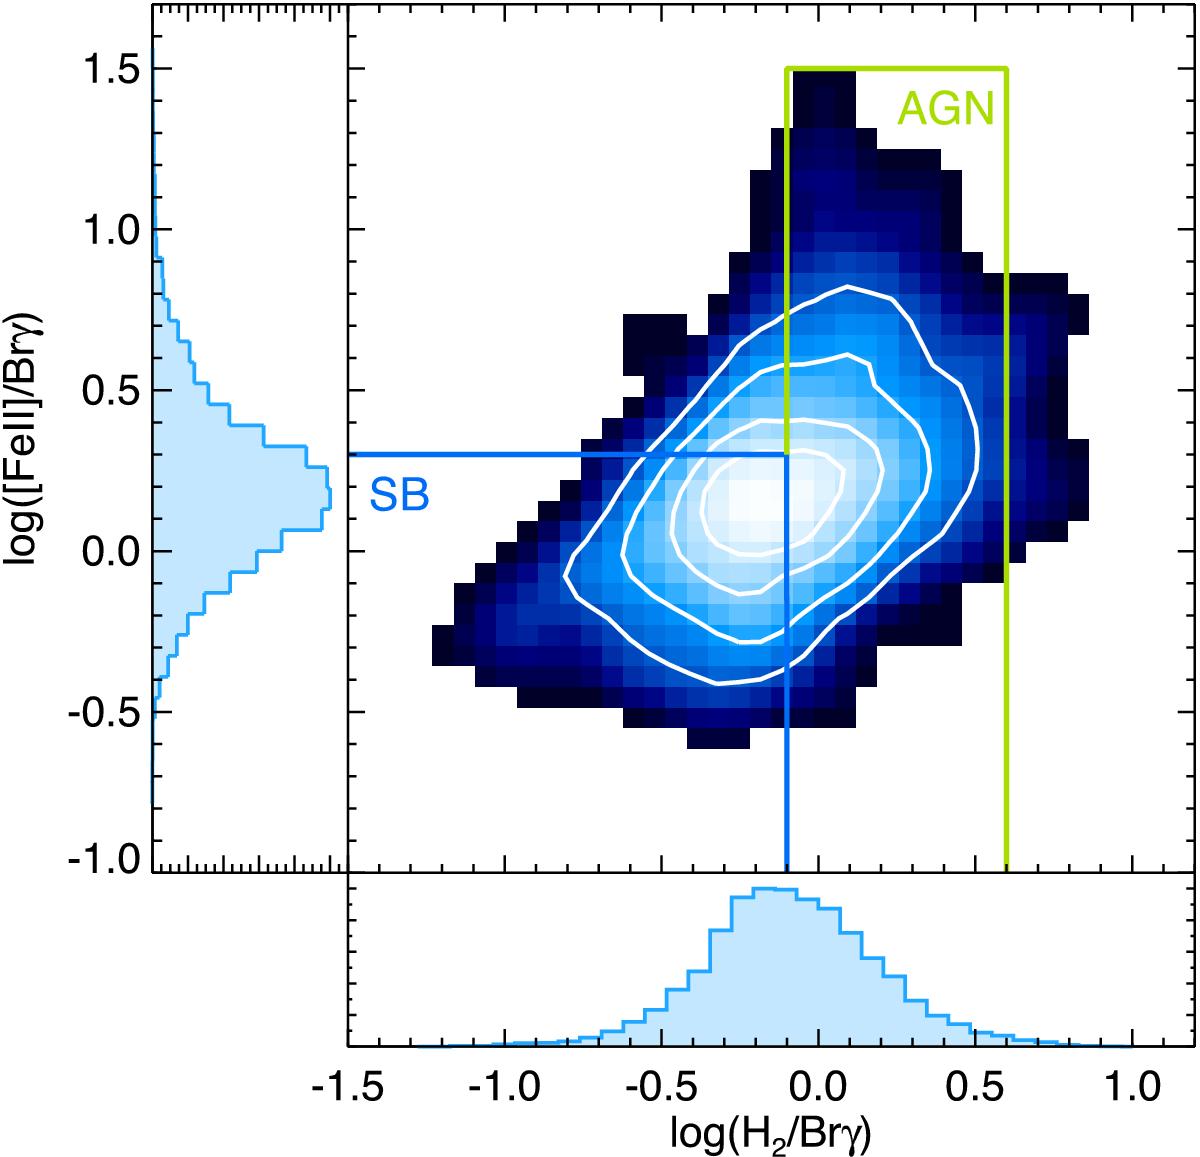
Distribution of the spatially resolved regions (spaxel-by-spaxel) in the log([FeII]1.64 μm/Brγ) − log(H22.12 μm/Brγ) plane for the sample of LIRGs. Contours encircle the areas were 25%, 50%, 75%, and 90% of the spaxels are contained. The histograms represent the distribution for the [FeII]1.64 μm/Brγ and H2/Brγ ratios with mode (log) values of +0.16 and −0.17, respectively. The blue and green lines indicate the upper limits for the young star-forming regions and AGNs as derived from our spatially resolved two-dimensional spectroscopy on the high surface brightness compact regions of the prototype LIRGs (see Sect. 3.3 for details).
Current usage metrics show cumulative count of Article Views (full-text article views including HTML views, PDF and ePub downloads, according to the available data) and Abstracts Views on Vision4Press platform.
Data correspond to usage on the plateform after 2015. The current usage metrics is available 48-96 hours after online publication and is updated daily on week days.
Initial download of the metrics may take a while.