Fig. 3
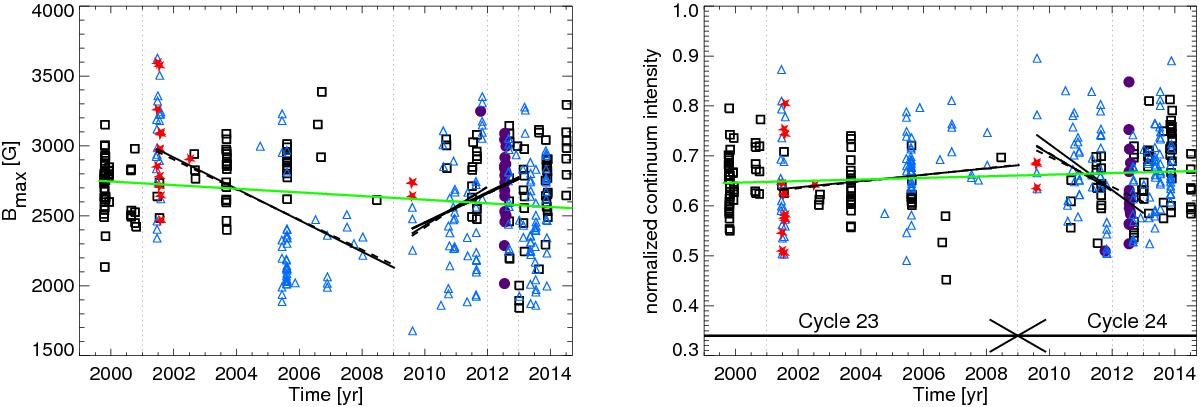
Variation of the maximum field strength (left) and the minimum continuum intensity (right) as a function of time. The vertical dotted lines at 2001 and 2009 indicate the maximum and minimum of cycle 23, respectively. The lines at 2012 and 2013 mark the possible maximum of cycle 24. The solid line shows a least-squares, the dashed line a Bayesian fit to the data between the corresponding vertical lines. The green line in both panels shows a linear fit to all data points. A summary of the fit parameters is presented in Table 2. Arrows indicate the temporal extent of the two cycles. For a description of different symbols, see Fig. 1.
Current usage metrics show cumulative count of Article Views (full-text article views including HTML views, PDF and ePub downloads, according to the available data) and Abstracts Views on Vision4Press platform.
Data correspond to usage on the plateform after 2015. The current usage metrics is available 48-96 hours after online publication and is updated daily on week days.
Initial download of the metrics may take a while.