Fig. 4
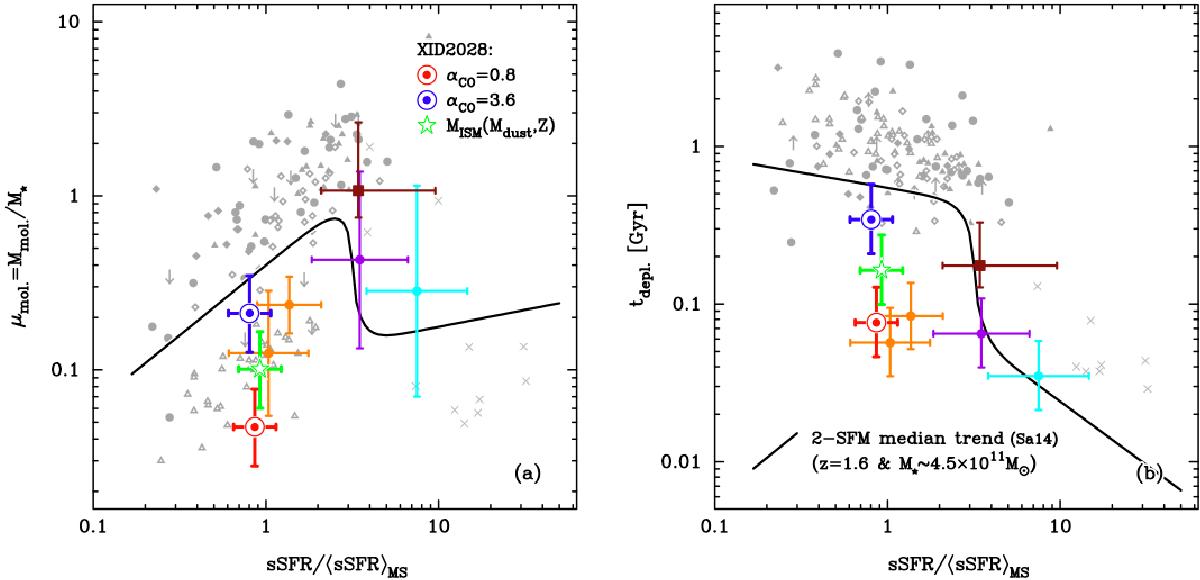
Gas fraction μmol(left panel) and depletion timescale (right panel) plotted versus the sSFR-excess for the same samples and with the same colour code presented in Fig. 3. The values for XID2028 are slightly offset in the x-axis for clarity. All quantities are normalized to the expected values for normal and Starburst galaxies predicted by the calibration presented in Sargent et al. (2014). The black line traces the expected variation (median) with sSFR for a MS spiral galaxy with identical mass and redshift as XID2028 (see Sargent et al. 2014). The step at sSFR/ ⟨ sSFR ⟩ ~ 4 reflects the transition from the main sequence locus to the sSFR-regime where high-SFE Starbursts dominate. XID2028 lies a factor ~2 to ~10 below the black line. I.e. it shows significant lower gas fraction and depletion timescale than those expected for the properties of its host galaxy.
Current usage metrics show cumulative count of Article Views (full-text article views including HTML views, PDF and ePub downloads, according to the available data) and Abstracts Views on Vision4Press platform.
Data correspond to usage on the plateform after 2015. The current usage metrics is available 48-96 hours after online publication and is updated daily on week days.
Initial download of the metrics may take a while.