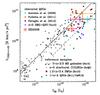
Fig. 3
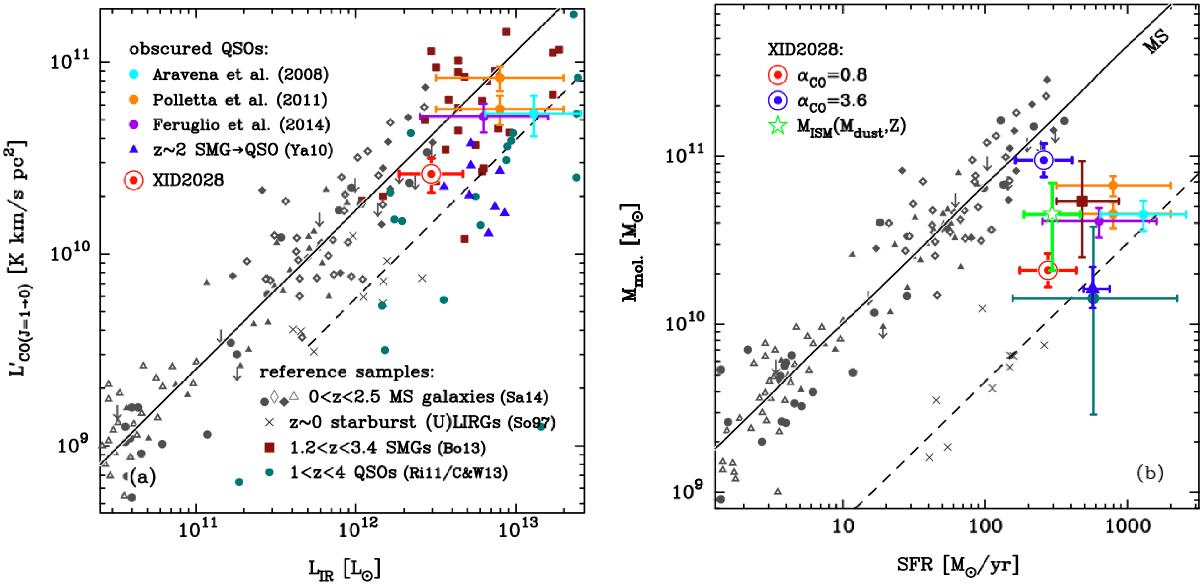
Left panel: L′(CO[1−0]) against the IR luminosity (8−1000 μm) showing a compilation of MS galaxies at 0 <z< 2.5 from the Sargent et al. (2014) work (Sa14; grey symbols), local ULIRGs from from So97, crosses SMGs from Bothwell et al. (2013; Bo13, filled brown squares), 1 <z< 4 QSOs with data from Riechers (2011) and Carilli & Walter (2013; R11/C&W13, light blue circles). The measurement for XID2028 obtained assuming r31 = 0.7 is shown as a red circle. Obscured QSOs proposed to be in the transition phase presented in Aravena et al. (2008), Polletta et al. (2011), Feruglio et al. (2014) and the MIPS-selected sources from Yan et al. (2010) are also marked, as labelled. Right panel: inverse, integrated Kennicutt-Schmidt relation between SFR and molecular gas mass. The colour points correspond to the position of XID2028 with different CO-to-H2 conversion factors: αCO = 3.6 (top; blue), and αCO = 0.8 (bottom; red). The green star shows the ISM mass inferred from the dust SED. All the values for XID2028 are slightly offset in the x-axis for clarity. Other points are taken from the same samples presented in the left panel. For the Bo13, R11/C&W13, and Ya10 samples we plot the median value with associated 16% and 84% percentiles. For the obscured QSOs all the authors used αCO = 0.8. In both panels, the solid black line is the best-fit relation for MS galaxies, and the dashed line defines the locus of strong SB galaxies with approximately 15 times shorter depletion time (Mmol/SFR) than MS galaxies (Sargent et al. 2014).
Current usage metrics show cumulative count of Article Views (full-text article views including HTML views, PDF and ePub downloads, according to the available data) and Abstracts Views on Vision4Press platform.
Data correspond to usage on the plateform after 2015. The current usage metrics is available 48-96 hours after online publication and is updated daily on week days.
Initial download of the metrics may take a while.