Fig. 2
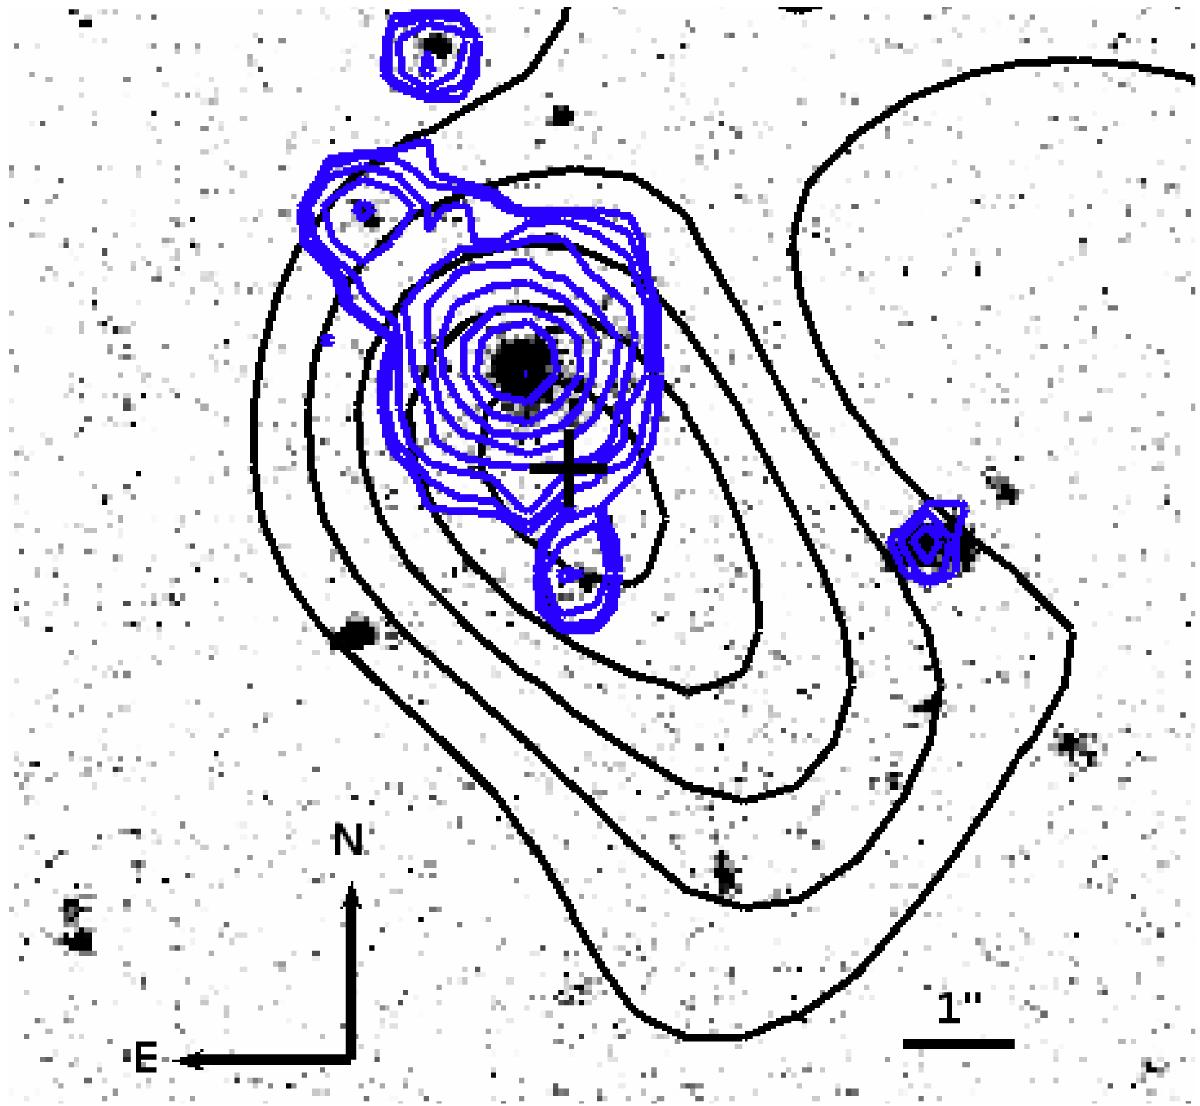
HST/ACS image (F814W filter) with superimposed K-band contours from CFHT (blue, arbitrary levels chosen to trace the whole K-band emission). Black contours represent CO(3−2) emission from the integrated map in the channels corresponding to the “systemic” peak of the line (same levels as in right panel of Fig. 1; starting from 1 sigma). The black cross (with associated ellipse) marks the line centroid. The image is about 10′′ across. The beam size is 4.5′′ × 3.4′′, with an angle of 38 degrees.
Current usage metrics show cumulative count of Article Views (full-text article views including HTML views, PDF and ePub downloads, according to the available data) and Abstracts Views on Vision4Press platform.
Data correspond to usage on the plateform after 2015. The current usage metrics is available 48-96 hours after online publication and is updated daily on week days.
Initial download of the metrics may take a while.