Fig. 1
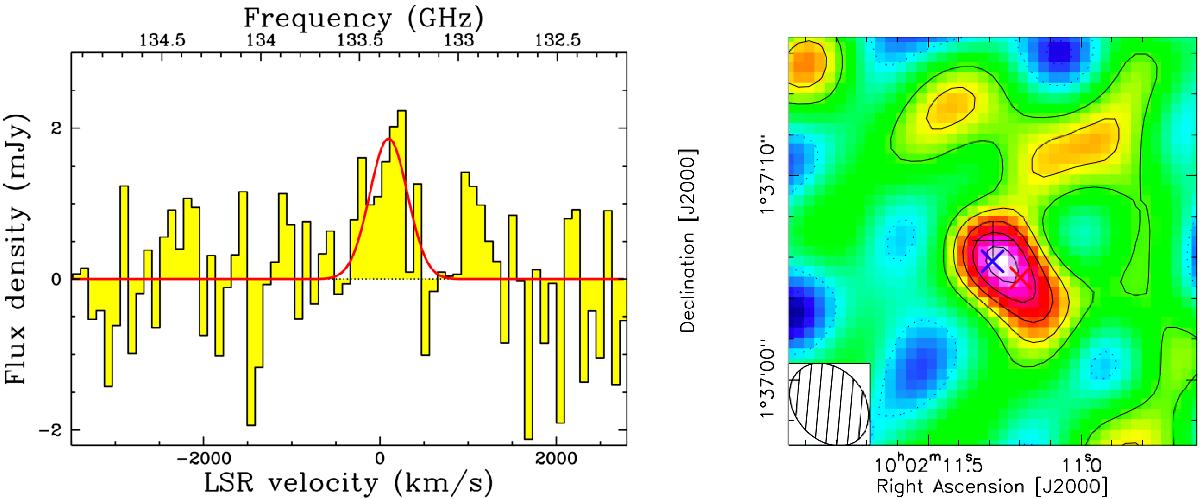
Left panel: spectrum of XID2028 integrated over the beam. The solid line shows a Gaussian fit with FWZI = 770 km s-1 and centred at the frequency corresponding to the redshift of the source. Right panel: integrated map of CO(3−2), in the channels corresponding to the “systemic” peak of the line. Contour levels are 1σ each (σ = 0.23 Jy km s-1). The synthesized beam is shown in the bottom-left corner. The black cross marks the phase centre (i.e. the ACS nucleus). The blue and red cross mark the positions of the blue and red line components, as derived from our spectroastrometric analysis.
Current usage metrics show cumulative count of Article Views (full-text article views including HTML views, PDF and ePub downloads, according to the available data) and Abstracts Views on Vision4Press platform.
Data correspond to usage on the plateform after 2015. The current usage metrics is available 48-96 hours after online publication and is updated daily on week days.
Initial download of the metrics may take a while.