Fig. 7
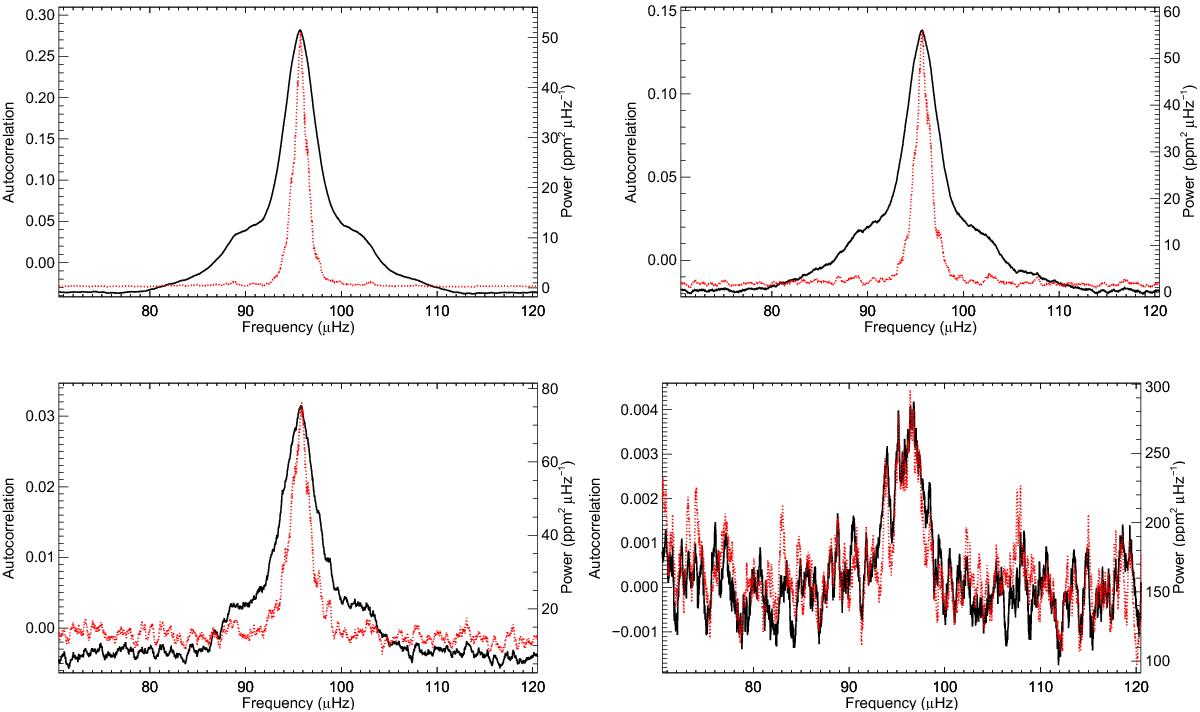
Comparison of the ranges around the value of Δν of the autocorrelation of the periodogram (solid black line) and the corresponding section of the envelope spectrum (dashed red line) for the time series without added noise (top left panel), with S/N = 1 (top right panel), with S/N = 1/4 (bottom left panel), and with S/N = 1/16 (bottom right panel). All data is boxcar smoothed over 0.5 μHz.
Current usage metrics show cumulative count of Article Views (full-text article views including HTML views, PDF and ePub downloads, according to the available data) and Abstracts Views on Vision4Press platform.
Data correspond to usage on the plateform after 2015. The current usage metrics is available 48-96 hours after online publication and is updated daily on week days.
Initial download of the metrics may take a while.