Fig. 6
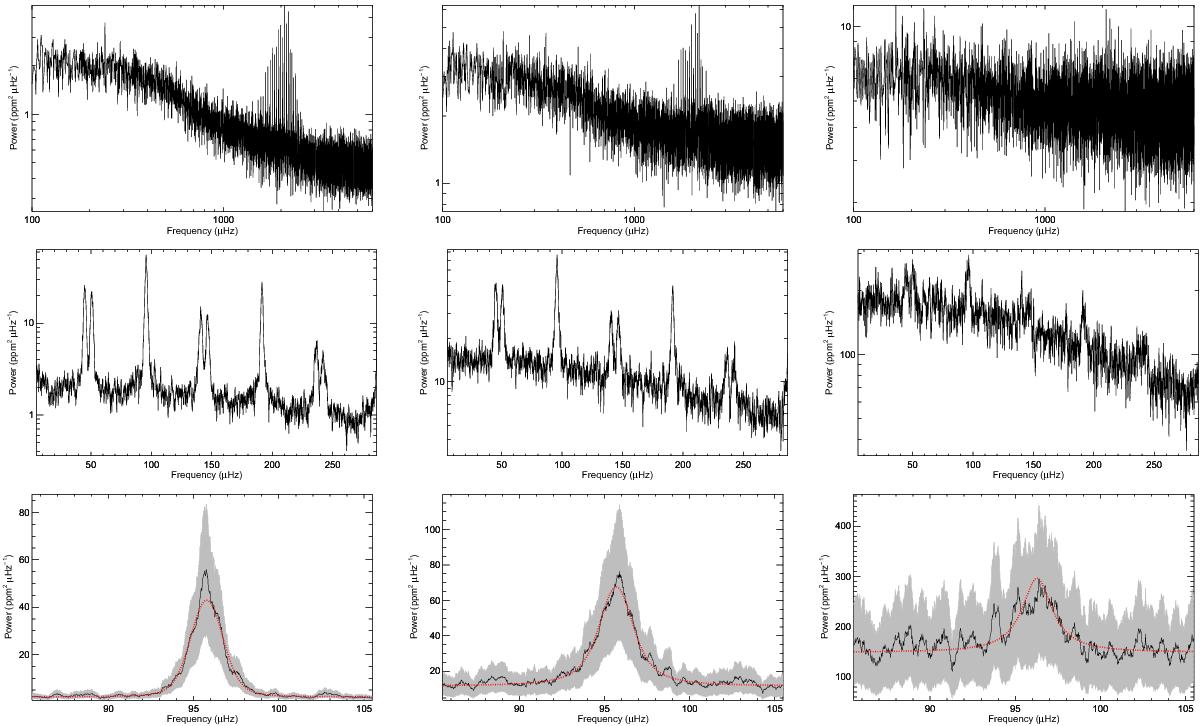
Top row: double logarithmic plot of the spectra of KIC 5184732 with an artificial S/N of 1, 1/4, and 1/16 (from left to right). All spectra are 0.5 μHz boxcar smoothed. Middle row: envelope spectra of the p-mode region between 1.4–2.7 mHz of the periodogram shown in the top panel. All envelope spectra are 0.5 μHz boxcar smoothed. Bottom row: fit of Voigt profiles (dashed red line) to the peak of the large frequency separation with 2σ confidence intervals in grey colour.
Current usage metrics show cumulative count of Article Views (full-text article views including HTML views, PDF and ePub downloads, according to the available data) and Abstracts Views on Vision4Press platform.
Data correspond to usage on the plateform after 2015. The current usage metrics is available 48-96 hours after online publication and is updated daily on week days.
Initial download of the metrics may take a while.