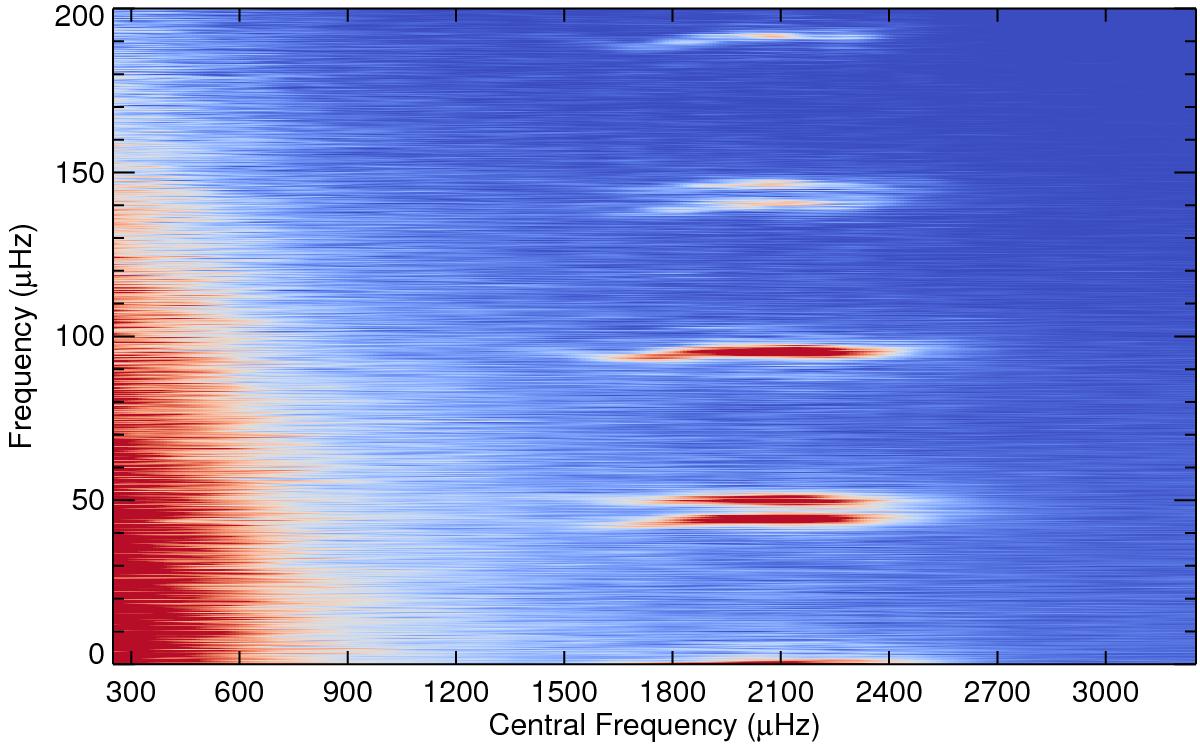
Fig. 5

Map of the envelope spectrum of KIC 5184732 as a function of central frequency of the used spectral filter which has a width of 500 μHz. A vertical cut at any central frequency value through this diagram is the respective envelope spectrum. Boxcar smoothed in y direction over 0.1 μHz. Red colour represents a high amplitude in the envelope spectrum, blue a low amplitude.
Current usage metrics show cumulative count of Article Views (full-text article views including HTML views, PDF and ePub downloads, according to the available data) and Abstracts Views on Vision4Press platform.
Data correspond to usage on the plateform after 2015. The current usage metrics is available 48-96 hours after online publication and is updated daily on week days.
Initial download of the metrics may take a while.


