Fig. 4
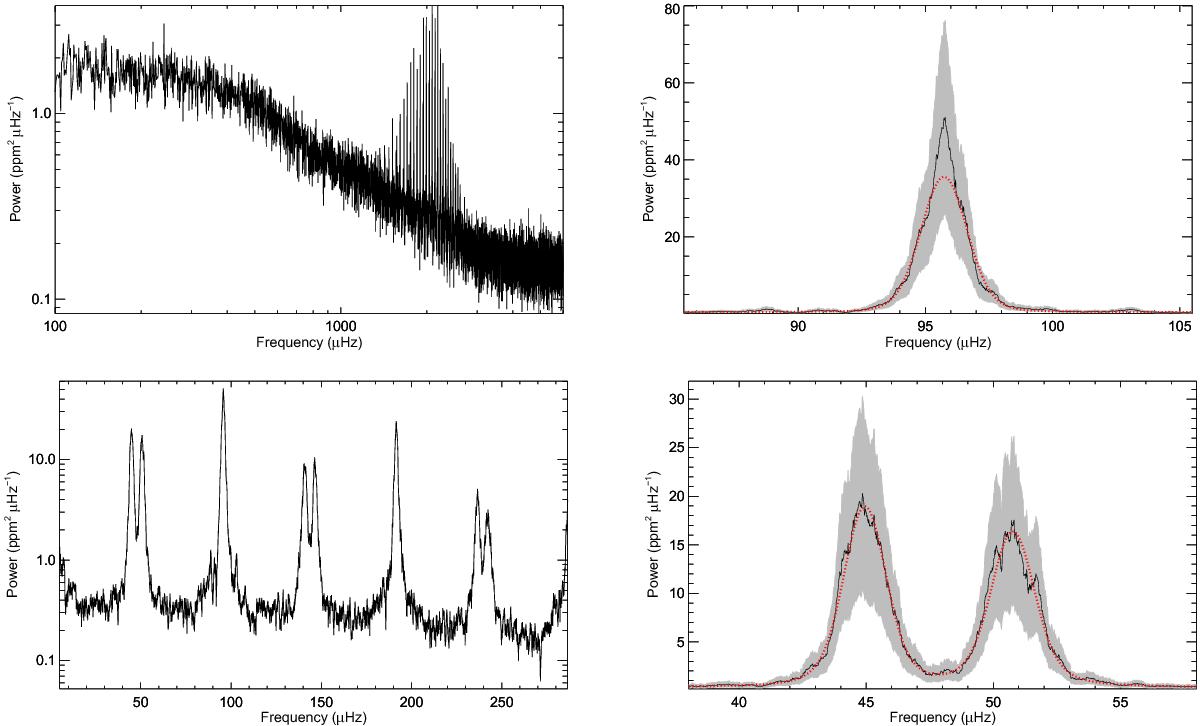
Top left panel: double-logarithmic plot of the spectrum for KIC 5184732. Boxcar smoothed over 0.5 μHz. Bottom left panel: spectrum of the signal envelope shown in Fig. 1 on a semi logarithmic scale. Peaks from dominant beat frequencies stand out against the background. Boxcar smoothed over 0.5 μHz. Top right panel: segment of the envelope spectrum around the peak which is due to the large frequency separation (black) with 2-σ confidence intervals in grey colour. The Voigt fit to the peak is shown in red (dashed line). Bottom right panel: segment of the envelope spectrum around the peaks from which the small separation can be computed (black) with 2σ confidence intervals in grey colour. The Voigt fit to the peaks is shown in red (dashed line).
Current usage metrics show cumulative count of Article Views (full-text article views including HTML views, PDF and ePub downloads, according to the available data) and Abstracts Views on Vision4Press platform.
Data correspond to usage on the plateform after 2015. The current usage metrics is available 48-96 hours after online publication and is updated daily on week days.
Initial download of the metrics may take a while.