Fig. 2
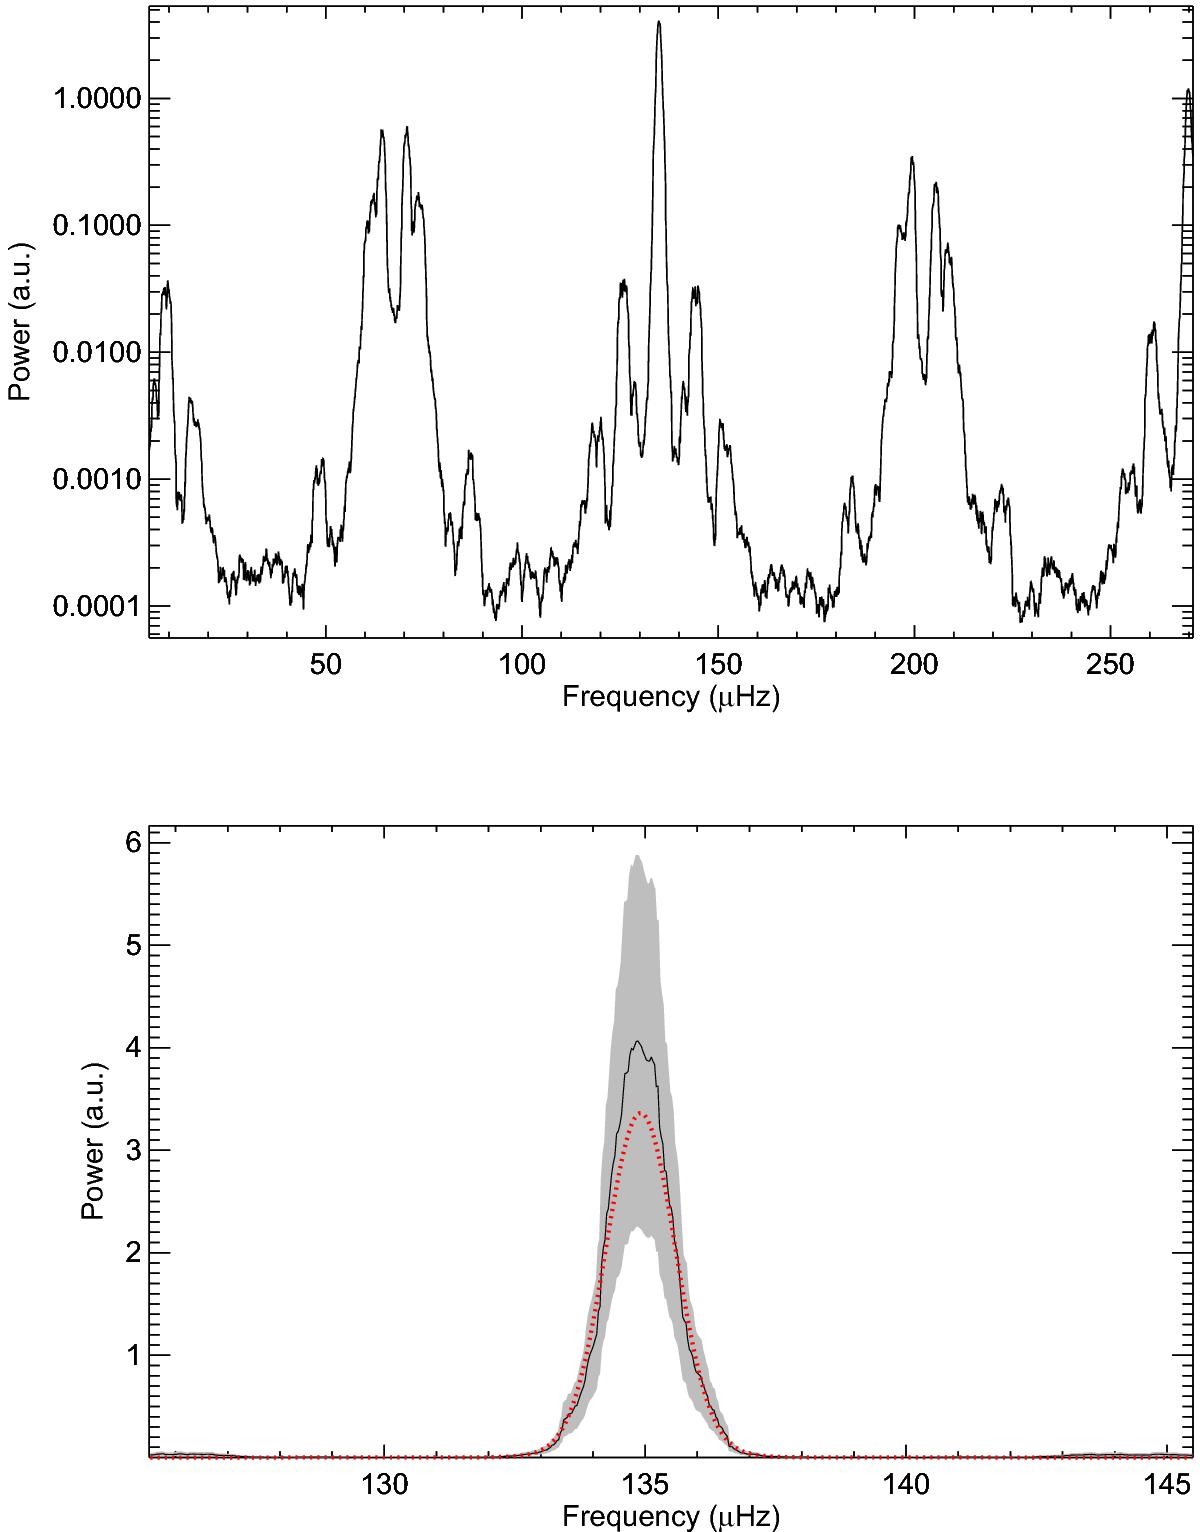
Top panel: semi-logarithmic plot of the low frequency part of the 1 μHz boxcar smoothed envelope spectrum for GOLF data. The periodogram was filtered for the frequency range of strong p-modes between 1.7−3.5 mHz. Bottom panel: fit of Voigt profile (dashed red line) to the peak of the large frequency separation in the envelope spectrum with 2σ confidence intervals in grey colour.
Current usage metrics show cumulative count of Article Views (full-text article views including HTML views, PDF and ePub downloads, according to the available data) and Abstracts Views on Vision4Press platform.
Data correspond to usage on the plateform after 2015. The current usage metrics is available 48-96 hours after online publication and is updated daily on week days.
Initial download of the metrics may take a while.