Fig. 13
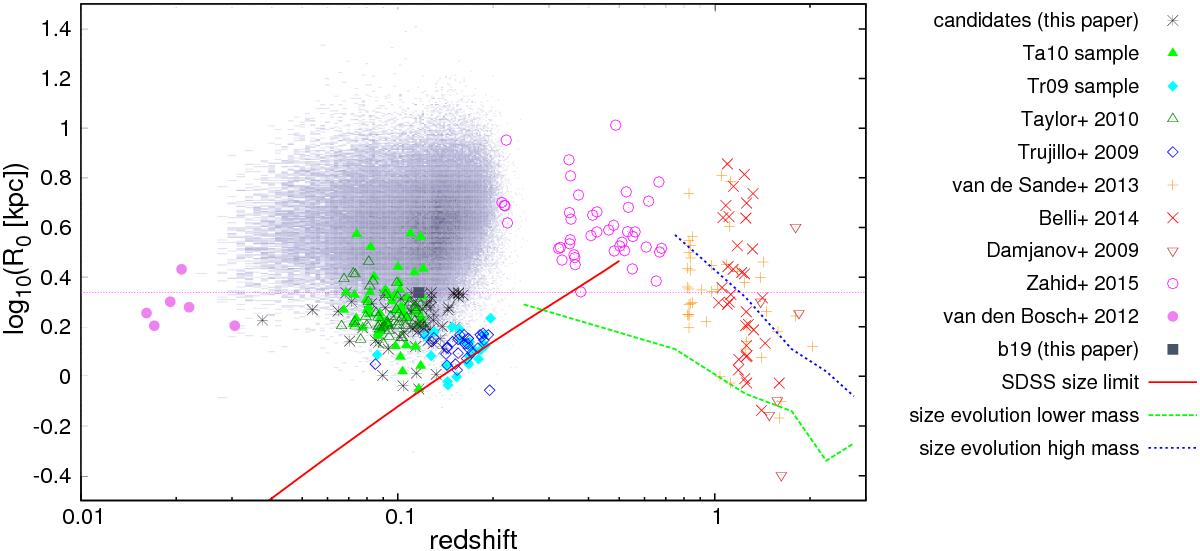
Redshift vs. size distribution for galaxies of different samples within a stellar mass range between 1010.75 M⊙ and 1011.25 M⊙. The blueish cloud in the background represents all galaxies of the basic sample with stellar masses greater than 1010.75 M⊙ and less than 1011.25 M⊙. The black stars represent the candidates of our sample. The galaxies of the Ta10 sample are shown using filled green triangles and the galaxies of the Tr09 sample are indicated by filled cyan diamonds. The galaxies from Taylor et al. (2010) using the values of their paper are indicated by open dark green triangles. The open blue diamonds represent the galaxies of Trujillo et al. (2009). Orange crosses denote the catalogue of various high redshift samples by van de Sande et al. (2013). The high redshift sample of Belli et al. (2014) is indicated by red Xs. Open brown nabla symbols indicate the high redshift galaxies of Damjanov et al. (2009). Open magenta circles indicate the intermediate redshift sample of Zahid et al. (2015). The six galaxies of van den Bosch et al. (2012) are represented by filled violet circles. Using our calibration of SDSS data, b19 is shown by a filled grey square. The magenta dashed line denotes the limiting scaling radius for our sample selection. The red solid line corresponds to the angular resolution limit of SDSS of 0.50 arcsec. The green dashed line denotes the 16-percentile range of the redshift evolution of an early-type galaxy with a stellar masses of 1010.75 M⊙ according to Table A1 of van der Wel et al. (2014b) and the blue dotted line indicates the 16-percentile range of the redshift evolution of an early-type galaxy with a stellar masses of 1011.25 M⊙ based on the same work.
Current usage metrics show cumulative count of Article Views (full-text article views including HTML views, PDF and ePub downloads, according to the available data) and Abstracts Views on Vision4Press platform.
Data correspond to usage on the plateform after 2015. The current usage metrics is available 48-96 hours after online publication and is updated daily on week days.
Initial download of the metrics may take a while.