Fig. 11
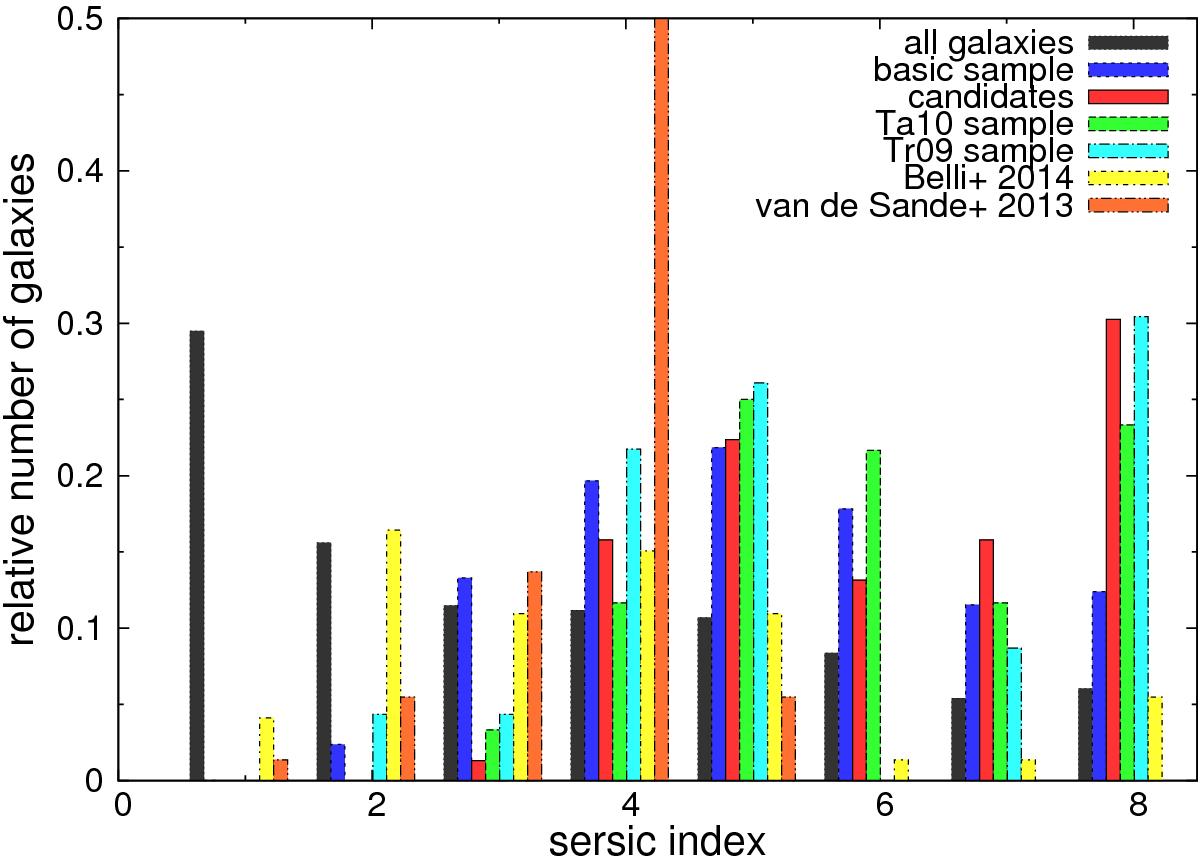
Distribution of the Sersic indices of different samples of galaxies. The black histogram corresponds to all galaxies in SDSS DR7 for which Simard et al. (2011) did their refits. The blue histogram corresponds to our basic sample, which consists of early-type galaxies alone. The green histogram represents the Ta10 sample, and the cyan histogram the Tr09 sample. The yellow histogram corresponds to sample of Belli et al. (2014) and the orange histogram indicated the distribution of the sample of van de Sande et al. (2013). The red histogram shows our 76 candidates.
Current usage metrics show cumulative count of Article Views (full-text article views including HTML views, PDF and ePub downloads, according to the available data) and Abstracts Views on Vision4Press platform.
Data correspond to usage on the plateform after 2015. The current usage metrics is available 48-96 hours after online publication and is updated daily on week days.
Initial download of the metrics may take a while.