Fig. 1
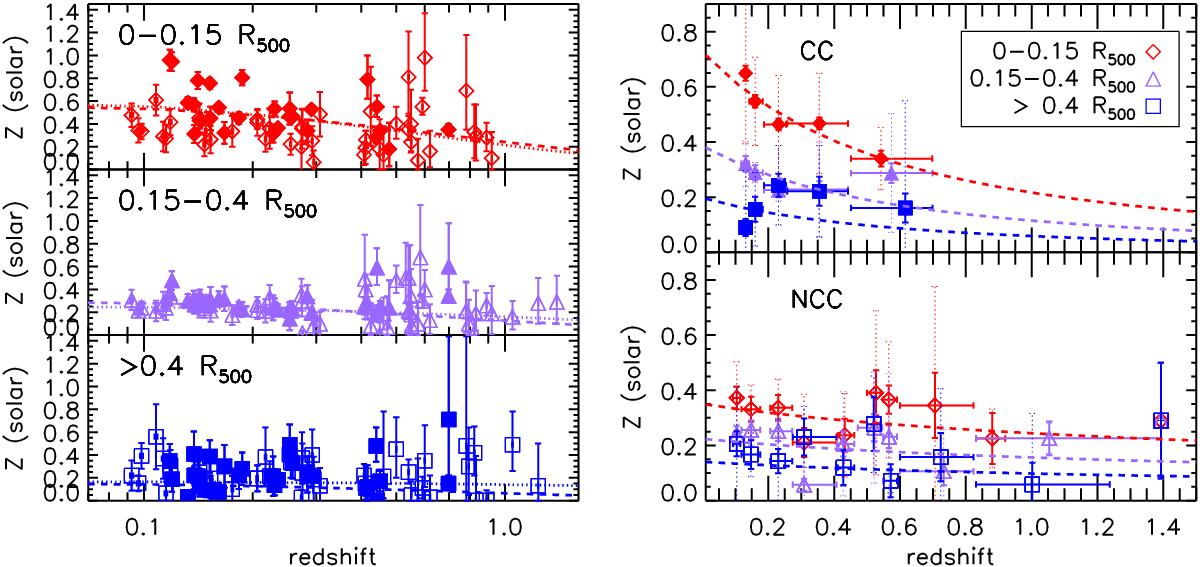
Abundance distribution as function of redshift as estimated in three radial bins (0−0.15 R500, 0.15−0.4 R500, and >0.4 R500). Filled points indicate CC clusters. Left: all data are plotted with the best fits done in the given radial bin (dotted line) and including the radial dependence (dashed line); right: the best fits in redshift and radius (dashed lines) are shown with representative data points obtained as a weighted mean, with the relative error (solid bars) and dispersion (dashed bars).
Current usage metrics show cumulative count of Article Views (full-text article views including HTML views, PDF and ePub downloads, according to the available data) and Abstracts Views on Vision4Press platform.
Data correspond to usage on the plateform after 2015. The current usage metrics is available 48-96 hours after online publication and is updated daily on week days.
Initial download of the metrics may take a while.