Fig. 8
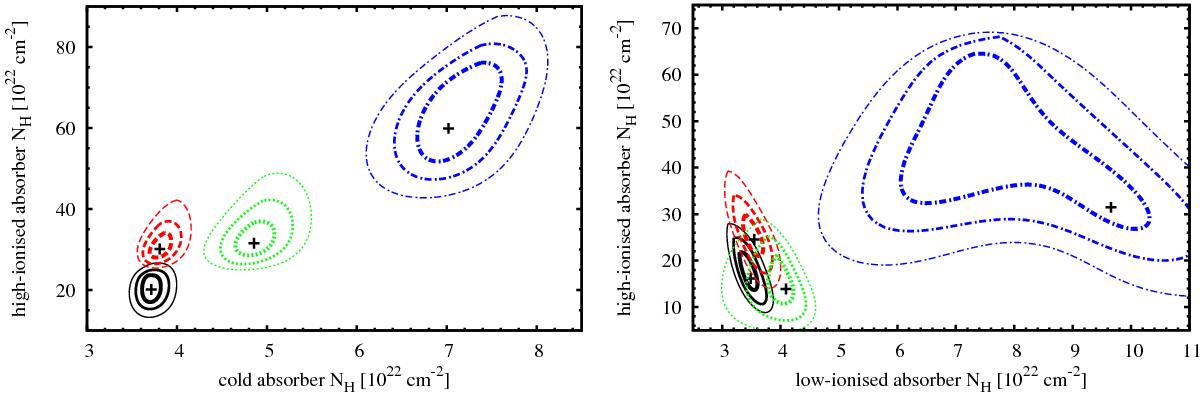
Contour plots between the column densities of the variable cold and warm absorbers. The colours correspond to different observations (1st black solid, 2nd red dashed, 3rd green dotted, 4th blue dash-dotted). The contours correspond to 1σ, 2σ, and 3σ levels. Left: results obtained with tModel B. Right: results obtained with Model D with the highly-ionised warm absorber allowed to vary.
Current usage metrics show cumulative count of Article Views (full-text article views including HTML views, PDF and ePub downloads, according to the available data) and Abstracts Views on Vision4Press platform.
Data correspond to usage on the plateform after 2015. The current usage metrics is available 48-96 hours after online publication and is updated daily on week days.
Initial download of the metrics may take a while.