Free Access
Fig. 3
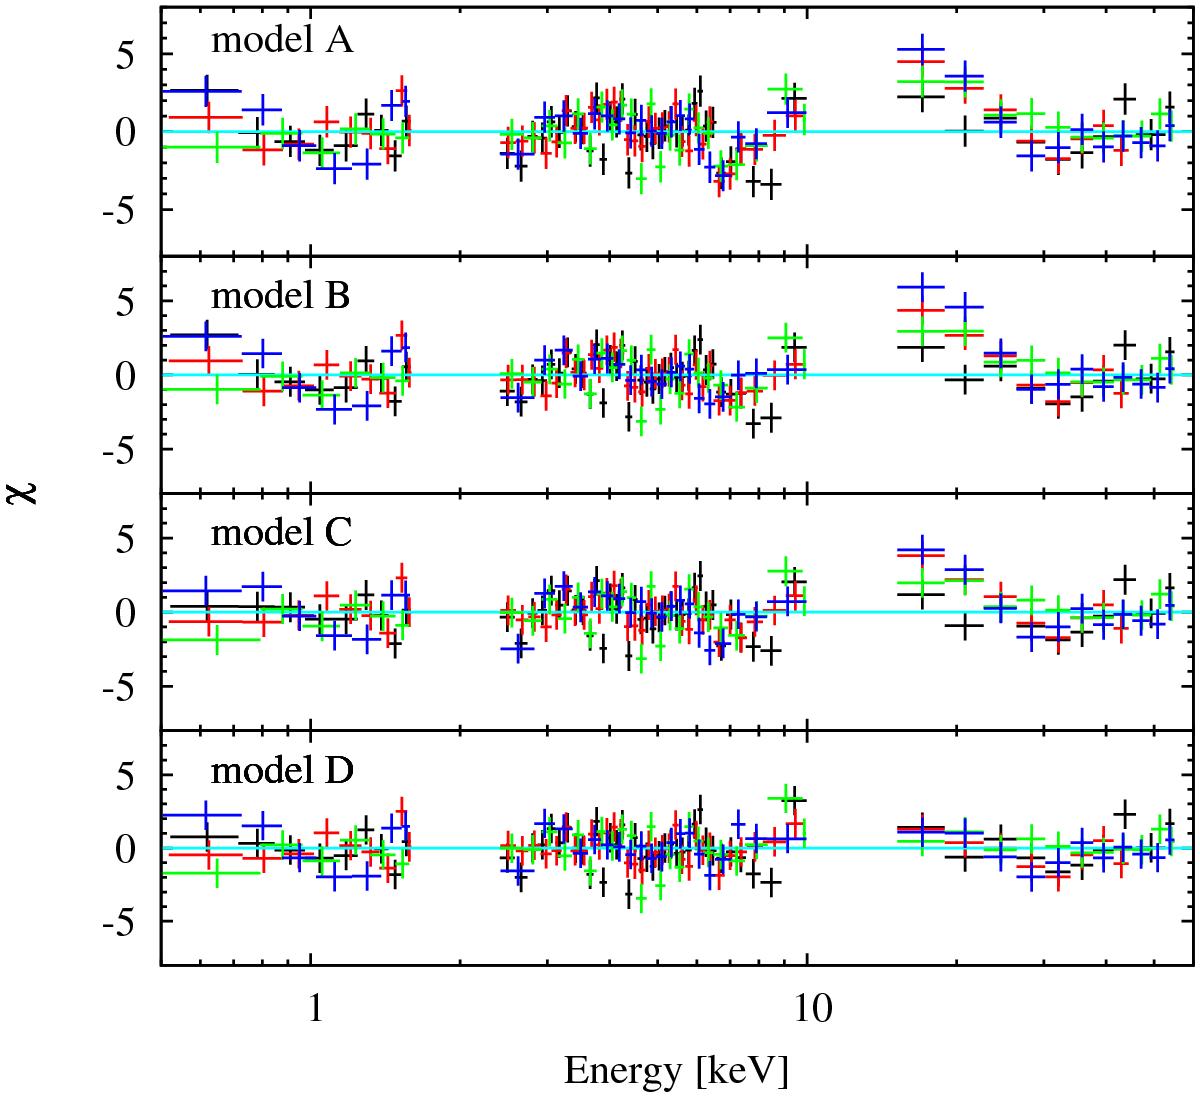
Data residuals from the different models for all observations (1st black, 2nd red, 3rd green, 4th blue). From top to bottom: residuals from the Models A–D.
Current usage metrics show cumulative count of Article Views (full-text article views including HTML views, PDF and ePub downloads, according to the available data) and Abstracts Views on Vision4Press platform.
Data correspond to usage on the plateform after 2015. The current usage metrics is available 48-96 hours after online publication and is updated daily on week days.
Initial download of the metrics may take a while.