Fig. 2
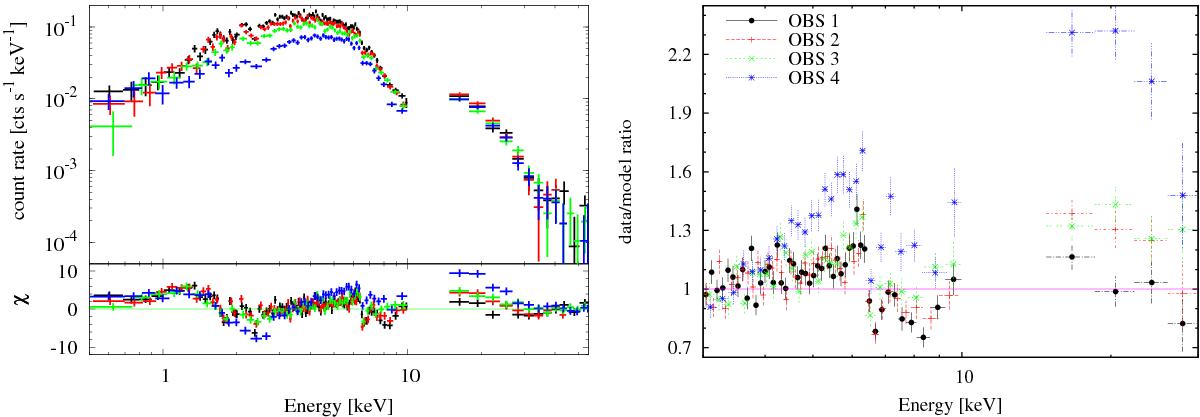
Left: Up: X-ray spectra of four Suzaku observations (1st black, 2nd red, 3rd green, 4th blue). Bottom: data residuals from a simple absorbed power-law model with Γ ≈ 1.7. Right: a more detailed look at the iron line and Compton hump as residuals from the simple absorbed power-law model. Only XIS 0 and HXD/PIN spectra are plotted for clarity. Data are re-binned for plotting purposes alone.
Current usage metrics show cumulative count of Article Views (full-text article views including HTML views, PDF and ePub downloads, according to the available data) and Abstracts Views on Vision4Press platform.
Data correspond to usage on the plateform after 2015. The current usage metrics is available 48-96 hours after online publication and is updated daily on week days.
Initial download of the metrics may take a while.